1

I develop cocos2d iOS app for iPad. When I test memory leaks and object allocation my Live Bytes are stable, but when I run Activity Monitor I see that the Real Memory Usage of my app increase every second with 0.02MB.

I want to ask is it normal and did someone have similar problems?

Faraona
  • 1,685
  • 2
  • 22
  • 33
  • It sounds like a memory leak. – Paul R Nov 05 '12 at 12:01
  • yes, but I cannot understand why this happens, no matter on which scene am I. – Faraona Nov 05 '12 at 12:07
  • You'll need to do some debugging to find the leak. Use a suitable tool or a divide-and-conquer approach. – Paul R Nov 05 '12 at 12:19
  • Debug using Instruments in XCode to find out the allocations,memory leaks and the actual RAM usage of your app. – Shantanu Nov 05 '12 at 14:17
  • you can see such behaviour if you create some objects in the scheduled method. the instruments will no show you leak if you delete these objects before your scene is deallocated, but you can dynamically create thousands of objects. that will cause memory increase – Morion Nov 05 '12 at 16:36

3 Answers3

1

This is entirely plausible, because Cocos2d (at least the 0.9.x and 1.0 branches) tends to autorelease everything. This can lead to memory build up on situations where you're spawning a lot of sprites onscreen in a loop. If you're indeed autoreleasing and not leaking, adding an autorelease pool along with your loop may be a quick fix. That said, you might actually be leaking.

To debug memory leaks, I'd start with the Leaks Instrument and perhaps the Allocations instrument as well. In Xcode, hit Command + I, or Product -> Profile

Xcode build menu

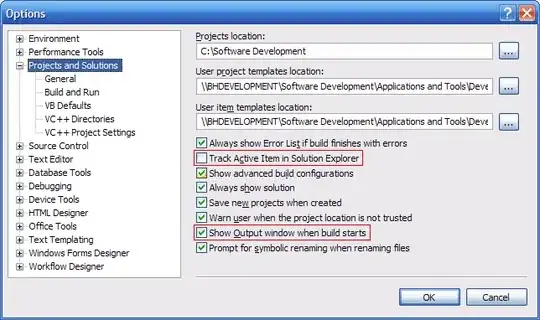
Once you've got the profiler open, you'll see a menu which contains a bunch of debugging instruments:

Instruments selection menu

Once you select leaks, you'll see this handy windows with all kinds of useful information:

enter image description here

On top, you'll see memory allocations and leaks as a graph. On the bottom you can see all kinds of useful information, such as what objects are allocated, how much memory is in use, and a lot more.

For a full treatment of Xcode debugging with instruments, check out this handy Apple Developer video (login required).

Moshe
  • 57,511
  • 78
  • 272
  • 425
  • Moshe thanks for explanation. I use this instruments to debug memory leaks. I didn't have red bars for memory leaks and my "Live Bites" are stable. But when i run "Activity Monitor" and check "Real Memory Usage". "Real Memory Usage" grow with 0.02MB on every second. I didn't do anything, I stay on my main scene and memory grow and this is everywhere on my scenes not only on MainScene. Is this normal?!?! And do you have any suggestion where is the reason for that increase of memory. – Faraona Nov 05 '12 at 14:43
1

A year later and I had this exact question. Turned out, I had zombies enabled and that was responsible for my increase in memory every second.

PWiggin
  • 956
  • 2
  • 12
  • 24
0

I remember that I have this problem because I log debug messages!

I logging this messages in loop cycles (every frame) and this was the reason why the memory increasing!

Please clear or comment all log messages, this will slove your problem :)

Faraona
  • 1,685
  • 2
  • 22
  • 33