Is there a good way easy way to add text labels to the circles on the graph? I haven't able to do it using the directlabels package because I get the error:
Error in direct.label.ggplot(p, "first.qp") : Need colour aesthetic to infer default direct labels."
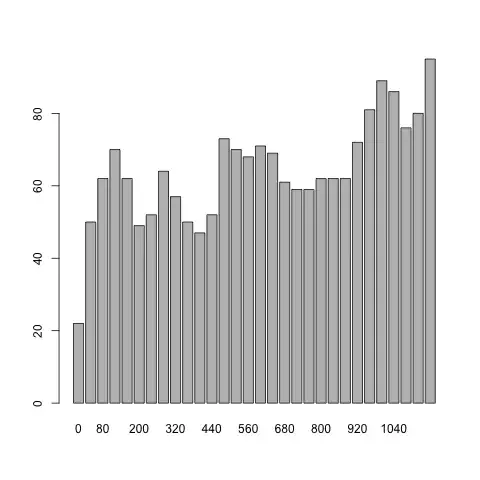
Here is the graph:
And here is the code that I've been using:
library(ggplot2)
library(directlabels)
#my data set:
oc <- read.csv("http://www.columbia.edu/~mad2200/oc.csv")
oc$percent_women <- oc$W_employment/(oc$M_employment+oc$W_employment)
oc$size <- oc$W_employment+oc$M_employment
p <- ggplot(oc, aes(M_w_earnings, W_w_earnings, label = as.character(Occupational.Group)))
p + geom_point(aes(size = size, colour=percent_women)) + scale_size_continuous(range=c(0,30)) + #scale_area()+
#geom_point(aes(colour = oc$percent_women)) +
coord_equal() +
scale_colour_gradient(high = "red")+
ylim(700, 1700) +
xlim(700, 1700) +
geom_abline(slope=1) +
labs(title = "Income Disparity by Occupation and Gender") +
ylab("Women's Weekly Earnings in $") +
xlab("Men's Weekly Earnings in $")