1

I am trying to plot the values of a bitwise circular shift on 1 byte. I'd like to have a slider let me change the original input value. I'm using the slider example on the matplotlib site for reference, but for some reason even though I pass in 0-255 as my slider range when I run my script the range is always 0-7. I'm guessing that somehow the slider is getting locked to my maximum number of x values, but I don't see how. How do I get the slider to let me pick the full 0-255 range?

Also, despite the min/max I've given the slider it inserts some padding for going below 0 at the front, and randomly draws a verticle line in the middle of my slider. How do I get rid of it? (also what is it for? The purpose isn't obvious to me)

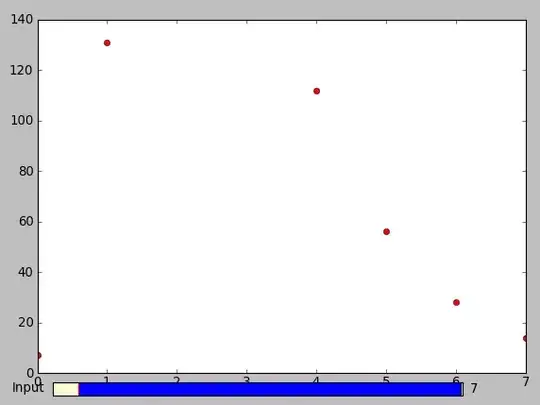
Picture of slider only going up to 7: enter image description here

Code:

import matplotlib.pyplot as plt
from matplotlib.widgets import Slider

from numpy import uint8
from numpy import uint16
from numpy import uint32
from numpy import uint64

def sizeof(x):
    return [uint8, uint16, uint32, uint64].index(x) + 1

def rot(x, i):
    return type(x)((x >> i) | (x << (sizeof(type(x))*8 - i))) 

def plotShifts(x):
    origType = type(x)
    maxval = type(x)(-1)

    numrots = sizeof(type(x)) * 8
    vals = [rot(x, i) for i in range(numrots)]

    print vals

    l, = plt.plot(range(numrots), vals, 'ro')

    axcolor = 'lightgoldenrodyellow'
    inputax = plt.axes([0.15, 0.05, 0.65, 0.03], axisbg=axcolor)
    inputsl = Slider(inputax, 'Input', 0, maxval, valinit=0, valfmt="%d")

    def update(x):
        vals = [rot(origType(x), i) for i in range(numrots)]
        l.set_ydata(vals)
        plt.draw()
    inputsl.on_changed(update)

    plt.axis([-0.5, numrots-1 + 0.5, -2, maxval + 2])

plotShifts(uint8(1))
plt.show()
Joseph Garvin
  • 20,727
  • 18
  • 94
  • 165

2 Answers2

3

The problem is in the last line plt.axis([-0.5, numrots-1 + 0.5, -2, maxval + 2]) which is acting on the axes that holds the slider, not on the axis with the data.

I would recommend using the OO interface to matplotlib rather than the pyplot interface for anything programmatic. The pyplot interface is good for interactive stuff, but it has a good deal of hidden state.

You also need to return a reference to the slider object due to the way call backs work.

import matplotlib.pyplot as plt
from matplotlib.widgets import Slider

from numpy import uint8
from numpy import uint16
from numpy import uint32
from numpy import uint64

def sizeof(x):
    return 2 ** [uint8, uint16, uint32, uint64].index(x)

def rot(x, i):
    return type(x)((x >> i) | (x << (sizeof(type(x))*8 - i))) 

def plotShifts(x):
    fig = plt.figure() # make a new figure
    ax = fig.add_axes([0.15, 0.2, 0.65, 0.7]) # add data axes
    origType = type(x)
    maxval = type(x)(-1)

    numrots = sizeof(type(x)) * 8
    vals = [rot(x, type(x)(i)) for i in range(numrots)]

    print vals
    print maxval
    l, = ax.plot(range(numrots), vals, 'ro') # plot to data axes

    axcolor = 'lightgoldenrodyellow'
    inputax = fig.add_axes([0.15, 0.05, 0.65, 0.03], axisbg=axcolor)
    inputsl = Slider(inputax, 'Input', 0, maxval, valinit=0, valfmt="%d")

    def update(x):
        vals = [rot(origType(x), origType(i)) for i in range(numrots)]
        l.set_ydata(vals)
        plt.draw()
    inputsl.on_changed(update)

    ax.set_ylim([-2,maxval +2]) # set ylim on data axes
    ax.set_xlim([-.5,numrots-1+.05]) # set xlim on data axes


    return inputsl

sldr = plotShifts(uint8(1))
plt.show()
tacaswell
  • 84,579
  • 22
  • 210
  • 199
  • doh! Totally forgot about how I was mixing the OOP and state machine interfaces. – Joseph Garvin Oct 19 '12 at 19:43
  • I know I can call axes to make an axes object, since I do that for the slider, but how do I attach it the plot? I've tried a few variations now, calling set_axes on the plot object or passing it in as the axes keyword to the constructor and they all make my plot disappear... – Joseph Garvin Oct 19 '12 at 20:07
1

most likely because maxval =7 in this line

inputsl = Slider(inputax, 'Input', 0, maxval, valinit=0, valfmt="%d")
Joran Beasley
  • 110,522
  • 12
  • 160
  • 179
  • Yeah it's 255 because when you assign -1 to an unsigned number you get the highest unsigned number, which for a uint8 is 255. – Joseph Garvin Oct 19 '12 at 19:33