14

I use matplotlib's method hexbin to compute 2d histograms on my data. But I would like to get the coordinates of the centers of the hexagons in order to further process the results.

I got the values using get_array() method on the result, but I cannot figure out how to get the bins coordinates.

I tried to compute them given number of bins and the extent of my data but i don't know the exact number of bins in each direction. gridsize=(10,2) should do the trick but it does not seem to work.

Any idea?

bmu
  • 35,119
  • 13
  • 91
  • 108
user1151446
  • 1,845
  • 3
  • 15
  • 22
  • I might be wrong but there doesn't seem to be a way of getting the coordinates. Luckily it's all open source (search for 'hexbin' in this file: https://github.com/matplotlib/matplotlib/blob/master/lib/matplotlib/axes.py) so you can check out how the grid is computed and replicate it in your code. Good luck! – Tobias Oct 19 '12 at 09:15
  • Hi, Thanks Tobold, I will check the source code you mention. – user1151446 Oct 19 '12 at 15:13

3 Answers3

22

I think this works.

from __future__ import division
import numpy as np
import math
import matplotlib.pyplot as plt

def generate_data(n):
    """Make random, correlated x & y arrays"""
    points = np.random.multivariate_normal(mean=(0,0),
        cov=[[0.4,9],[9,10]],size=int(n))
    return points

if __name__ =='__main__':

    color_map = plt.cm.Spectral_r
    n = 1e4
    points = generate_data(n)

    xbnds = np.array([-20.0,20.0])
    ybnds = np.array([-20.0,20.0])
    extent = [xbnds[0],xbnds[1],ybnds[0],ybnds[1]]

    fig=plt.figure(figsize=(10,9))
    ax = fig.add_subplot(111)
    x, y = points.T
    # Set gridsize just to make them visually large
    image = plt.hexbin(x,y,cmap=color_map,gridsize=20,extent=extent,mincnt=1,bins='log')
    # Note that mincnt=1 adds 1 to each count
    counts = image.get_array()
    ncnts = np.count_nonzero(np.power(10,counts))
    verts = image.get_offsets()
    for offc in xrange(verts.shape[0]):
        binx,biny = verts[offc][0],verts[offc][1]
        if counts[offc]:
            plt.plot(binx,biny,'k.',zorder=100)
    ax.set_xlim(xbnds)
    ax.set_ylim(ybnds)
    plt.grid(True)
    cb = plt.colorbar(image,spacing='uniform',extend='max')
    plt.show()

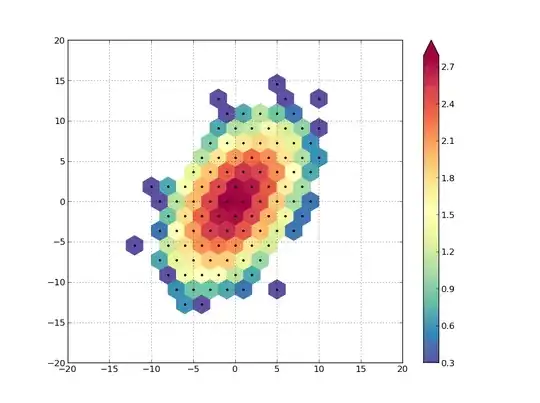
enter image description here

Hooked
  • 84,485
  • 43
  • 192
  • 261
user1868739
  • 258
  • 2
  • 4
  • 1
    Can you provide a version number for modules run with this code? I do not get any data from get_offsets(): In [1]: verts = image.get_offsets() In [2]: verts Out[2]: array([], dtype=float64) This is running matplotlib 1.0.1, numpy 1.5.1 – Dave Apr 24 '13 at 21:12
  • 1
    I've taken the liberty to edit your question to include the picture that it generates. Great answer! – Hooked Jul 17 '13 at 14:28
2

I would love to confirm that the code by Hooked using get_offsets() works, but I tried several iterations of the code mentioned above to retrieve center positions and, as Dave mentioned, get_offsets() remains empty. The workaround that I found is to use the non-empty 'image.get_paths()' option. My code takes the mean to find centers but which means it is just a smidge longer, but it does work.

The get_paths() option returns a set of x,y coordinates embedded that can be looped over and then averaged to return the center position for each hexagram.

The code that I have is as follows:

counts=image.get_array() #counts in each hexagon, works great
verts=image.get_offsets() #empty, don't use this
b=image.get_paths()   #this does work, gives Path([[]][]) which can be plotted

for x in xrange(len(b)):
    xav=np.mean(b[x].vertices[0:6,0]) #center in x (RA)
    yav=np.mean(b[x].vertices[0:6,1]) #center in y (DEC)
    plt.plot(xav,yav,'k.',zorder=100)
1

I had this same problem. I think what needs to be developed is a framework to have a HexagonalGrid object which can then be applied to many different data sets (and it would be awesome to do it for N dimensions). This is possible and it surprises me that neither Scipy or Numpy has anything for it (furthermore there seems to be nothing else like it except perhaps binify)

That said, I assume you want to use hexbinning to compare multiple binned data sets. This requires some common base. I got this to work using matplotlib's hexbin the following way:

import numpy as np
import matplotlib.pyplot as plt

def get_data (mean,cov,n=1e3):
    """
    Quick fake data builder
    """
    np.random.seed(101)
    points = np.random.multivariate_normal(mean=mean,cov=cov,size=int(n))
    x, y = points.T
    return x,y

def get_centers (hexbin_output):
    """
    about 40% faster than previous post only cause you're not calculating the 
    min/max every time 
    """
    paths = hexbin_output.get_paths()
    v = paths[0].vertices[:-1] # adds a value [0,0] to the end
    vx,vy = v.T

    idx = [3,0,5,2] # index for [xmin,xmax,ymin,ymax]    
    xmin,xmax,ymin,ymax = vx[idx[0]],vx[idx[1]],vy[idx[2]],vy[idx[3]]

    half_width_x = abs(xmax-xmin)/2.0
    half_width_y = abs(ymax-ymin)/2.0

    centers = []
    for i in xrange(len(paths)):
        cx = paths[i].vertices[idx[0],0]+half_width_x
        cy = paths[i].vertices[idx[2],1]+half_width_y
        centers.append((cx,cy))

    return np.asarray(centers)


# important parts ==>

class Hexagonal2DGrid (object):
    """
    Used to fix the gridsize, extent, and bins
    """
    def __init__ (self,gridsize,extent,bins=None):
        self.gridsize = gridsize
        self.extent = extent
        self.bins = bins

def hexbin (x,y,hexgrid):
    """
    To hexagonally bin the data in 2 dimensions
    """
    fig = plt.figure()
    ax = fig.add_subplot(111)

    # Note mincnt=0 so that it will return a value for every point in the 
    # hexgrid, not just those with count>mincnt

    # Basically you fix the gridsize, extent, and bins to keep them the same
    # then the resulting count array is the same
    hexbin = plt.hexbin(x,y, mincnt=0,
                        gridsize=hexgrid.gridsize, 
                        extent=hexgrid.extent,
                        bins=hexgrid.bins)
    # you could close the figure if you don't want it
    # plt.close(fig.number)

    counts = hexbin.get_array().copy() 
    return counts, hexbin

# Example ===>
if __name__ == "__main__":
    hexgrid = Hexagonal2DGrid((21,5),[-70,70,-20,20])
    x_data,y_data = get_data((0,0),[[-40,95],[90,10]])
    x_model,y_model = get_data((0,10),[[100,30],[3,30]])

    counts_data, hexbin_data = hexbin(x_data,y_data,hexgrid)
    counts_model, hexbin_model = hexbin(x_model,y_model,hexgrid)

    # if you want the centers, they will be the same for both 
    centers = get_centers(hexbin_data) 

    # if you want to ignore the cells with zeros then use the following mask. 
    # But if want zeros for some bins and not others I'm not sure an elegant way
    # to do this without using the centers
    nonzero = counts_data != 0

    # now you can compare the two data sets
    variance_data = counts_data[nonzero]
    square_diffs = (counts_data[nonzero]-counts_model[nonzero])**2
    chi2 = np.sum(square_diffs/variance_data)
    print(" chi2={}".format(chi2))
The Doctor
  • 334
  • 3
  • 11