If I am using R to plot. How can I assign a particular shape to data points belonging to one category (using the pch argument to plot()) based on a column in my data frame that has the categorical data? Will using as.factor() to group data and then using pch help ?
Asked
Active
Viewed 4.0k times
18
Jon Clements
- 138,671
- 33
- 247
- 280
Anurag Mishra
- 1,007
- 6
- 16
- 23
1 Answers
40
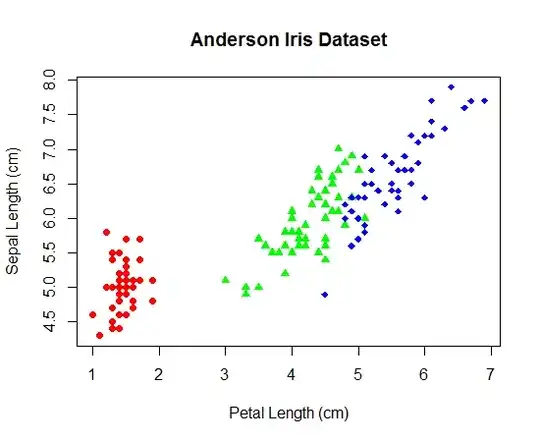
You mean something like this...?
plot(Sepal.Length ~ Petal.Length,
      xlab = "Petal Length (cm)",
      ylab = "Sepal Length (cm)",
      pch = c(16, 17, 18)[as.numeric(Species)],  # different 'pch' types
      main = "Anderson Iris Dataset",
      col = c("red", "green","blue")[as.numeric(Species)],
      data = iris)
Which produces:
Jilber Urbina
- 58,147
- 10
- 114
- 138