2

I'm new to ParaView and completely lost with all the different data formats. All I want to do is display an elevation grid which is produced by a program. I store the elevation grid in a two dimensional array of floats which is indexed by x and y coordinates and stores the z coordinate. In other words elevationGrid[x][y] stores the height above the point (x, y).

Which file format should I use for this and how is it defined? It would be ideal if someone could give an example file for, say, a 3x3 grid.

Chris
  • 44,602
  • 16
  • 137
  • 156
Richard
  • 162
  • 1
  • 4
  • 11

2 Answers2

15

A first approach with a 5x5 grid and equation z = x^2+y^2, using a very simple input format. This is a general approach, not especially dedicated to structured grid. The following has been done with Paraview 3.14.1.

1) Save your data in csv format, i.e. :

"x","y","z"
-0.5,-0.5,0.5
-0.30000001,-0.5,0.34000001
-0.1,-0.5,0.26
[...]
0.1,0.5,0.26
0.30000001,0.5,0.34000001
0.5,0.5,0.5

2) Open in Paraview your csv file

Fill the required import options.

3) Convert your table to geometrical points

Apply Filters > Alphabetical > Table to points

You will be asked to give each variables for each coordinates.

4) Display 3D view to see your points

Create a new visualization view (add a new tab) and choose "3D View". Activate your TableToPoints filter clicking on the little eye near its name in the pipeline.

If evething is okay, at this point you will see your scatter plot.

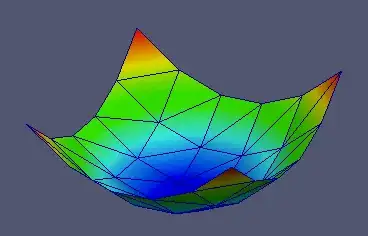
5) Last step: create a surface

Apply Filters > Alphabetical > Delaunay 2D

And using default options, one finally obtains:

elevation

EDIT:

I remember the name of the dedicated function to create elevation map... It is the Wrap by scalar function. You can combine it with some above steps to get more easily what you want. I could give you an example if necessary.

Community
  • 1
  • 1
Remy F
  • 1,479
  • 15
  • 20
0

Maybe the answer does not fit 100% with the question, but it happened that when I was looking in the web for ways to create an elevation map in Paraview from a TIF file, I always fallen on this page.

Therefore, my answer provides the instructions about how to create an elevation map from a TIF file (for example, a raster file coming out from QGIS). The steps I use to create the elevation map are:

  1. Import the TIF (use for example the GDAL reader)
  2. (optional) If needed, apply some other filter of a Threshold to mask some NaN values that have been set to values line -9999 of something similar.
  3. Apply the filter Cell Data to Point Data
  4. Apply the filter Warp By Scalar (thank you Remy F. for the suggestion). Here, depending of your data and your visualization purposes, you can increase the Scale Factor parameter.

(as some years passed since this question was asked, for completeness I also report the Paraview version I am using now: 5.10)

Alessandro
  • 371
  • 3
  • 11