I am trying to cluster a protein dna interaction dataset, and draw a heatmap using heatmap.2 from the R package gplots. Here is the complete process that I am following to generate these graphs: Generate a distance matrix using some correlation in my case pearson.
library(RColorBrewer);
library(gplots);
args <- commandArgs(TRUE);
matrix_a <- read.table(args[1], sep='\t', header=T, row.names=1);
mtscaled <- as.matrix(scale(matrix_a))
pdf("result.pdf", pointsize = 15, width = 18, height = 18)
result <- heatmap.2(mtscaled, Colv=T,Rowv=T, scale='none',symm = T, col = brewer.pal(9,"Reds"))
dev.off()
I am able to acomplish this with the normal heatmap function by doing the following:
result <- heatmap(mtscaled, Colv=T,Rowv=T, scale='none',symm = T)
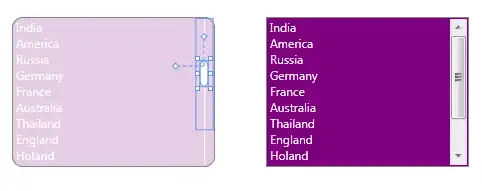
However when I use the same settings for Heatmap.2 the clusters don't line up as well on the diagonal. I have attached 2 images the first image uses heatmap and the second image uses heatmap.2. I have used the Reds color from the package RColorBrewer to help better show what I am taking about. I would normally just use the default heatmap function, but I need the color variation that heatmap.2 provides.
Here is a list to the dataset used to generate the heatmaps, after it has been turned into a distance matrix: DataSet