0

I'm having trouble with Maple.

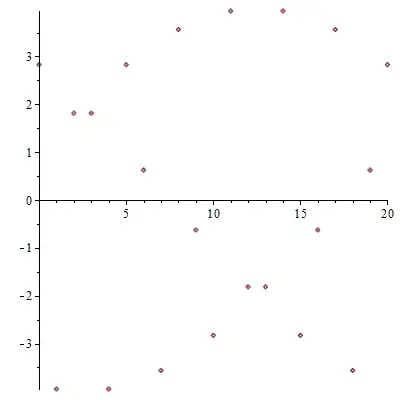
I have a cosine wave, which I figured out how to plot, but now I have to take samples from that wave and plot those(as dots) over top of the original cosine wave. Here is the question from the assignment:

"Produce the samples from Q1 above and plot the result (plot the points on a plot of the cosine wave - use different colours for both, it will look like a cosine wave with dots on it)"

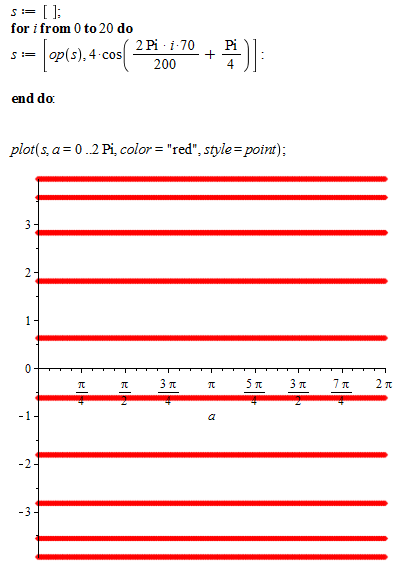
Problem is, my samples keep being straight lines at different heights

enter image description here

http://i197.photobucket.com/albums/aa221/Haseo_Ame/Maple.png

I'm not sure what I'm doing wrong since I've never used maple before.

Bernhard
  • 3,619
  • 1
  • 25
  • 50

1 Answers1

0

Firstly, try not to build up lists using repeated concatenation (which can incur an O(n^2) in resources) if you can use the seq command instead (which can incur an O(n) cost in resources). You should always reconsider, when coding like s:=[op(s),...] in a loop.

Next, a point-plot needs pairs of x-y values. Your list is just a collection of scalar values, and hence is being interpreted as a collection of constant functions to be plotted.

The pairs of x-y values can be in a list of (2-element) lists such as [[x1,y1],...,[xn,yn]

It's not clear how you want your x-axis scaled, but you could start off with something like this,

s:=[seq([i, 4*cos(2*Pi*i*70/200+Pi/4)],i=0..20)]:

plot(s, style=point);

enter image description here

#  s:=[seq([2*Pi*i*70/200+Pi/4, 4*cos(2*Pi*i*70/200+Pi/4)],i=0..20)]:

ps. Please post source code as text, not as embedded images, so that anyone trying to help needn't type it all in.

acer
  • 6,671
  • 15
  • 15
  • Thank you; it took a bit of working out, but I think I got it. Sorry about not posting the code as text, I'm still figuring out the posting system here. – Lucifer Fayte Sep 27 '12 at 14:57