The problem
I was going through the methods by which Wolfram's Mathematica generates random numbers and found that it uses the Cellular Automata Rule 30. The underlying explanation of it goes as follows:
The evolution of an elementary cellular automaton can completely be described by a table specifying the state a given cell will have in the next generation based on the value of the cell to its left, the value the cell itself, and the value of the cell to its right.
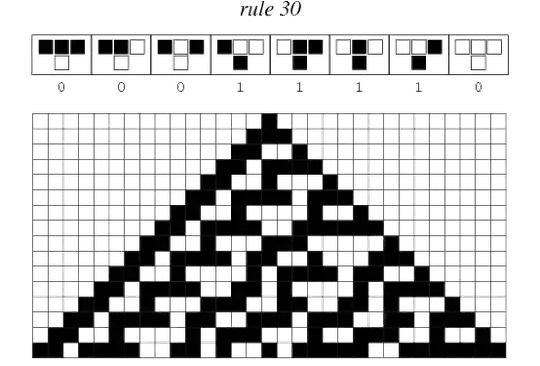
Since there are 2 x 2 x 2 = 2^3 = 8 possible binary states for the three cells neighboring a given cell, there are a total of 2^8 = 256 elementary cellular automata, each of which can be indexed with an 8-bit binary number (Wolfram 1983, 2002). For example, the table giving the evolution of rule 30 (in binary, rule 30 is written as 30 = 00011110) is illustrated down below. In this diagram, the possible values of the three neighboring cells are shown in the top row of each panel, and the resulting value the central cell takes in the next generation is shown below in the center.
The Question
How does the above diagram relate to the individual patterns in the upper part of the table? I know that the diagram is composed of them but confused as to how it forms sequentially. I don't see any row/column distinguishing feature that could perhaps tell me that those layers have been built using the upper rows in the given table. In short, I want to see the tetris sort of phenomenon behind this