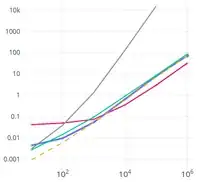
I want to do some modifications of a geom_boxplot(). Because my boxplots are really "small" sometimes (see yellow and green clade in the graphic here) i want to highlight the median even more. so is it possible to adjust the thickness of the median line?
Asked
Active
Viewed 1.3k times
1 Answers
34
This solution is not obvious from the documentation, but luckily does not require us to edit the source code of ggplot2. After digging through the source of ggplot2 I found that the thickness of the median line is controlled by the fatten parameter. By default fatten has a value of two:
require(reshape)
require(ggplot2)
cars_melt = melt(cars)

ggplot(aes(x = variable, y = value), data = cars_melt) +
  geom_boxplot(fatten = 2)
But if we increase the value to for example 4, the median line becomes thicker.
ggplot(aes(x = variable, y = value), data = cars_melt) +
  geom_boxplot(fatten = 4)
Paul Hiemstra
- 59,984
- 12
- 142
- 149
-
How does the width of the median line relate to `lwd`? Is it a multiplier of whatever is specified for `lwd`, or is it a measurement of its own? – Canned Man Nov 30 '16 at 12:28
-
In case it's not obvious, changing `fatten` to a value less than 2 will make it thinner--helpful when your bars are really small and the median line is taking up most of the bar. – Lauren Fitch Jun 30 '17 at 17:43