I'm trying to profile my C code with gprof. I'm compiling .a library with -pg option and compiling executable also with -pg and with this .a library.
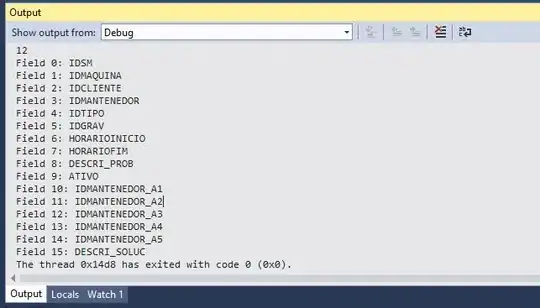
Running. Getting gmon.out. Viewing it using Eclipse. And all I getting is something like showed at screenshot bellow.
I assume there should be some functions instead those addresses.
Can somebody tell me how to fix it?
Thanks in advance,
- Ilya.
Asked
Active
Viewed 202 times
0
hasnobrains
- 109
- 6
-
Compile also with `-g`. In some cases, `-rdynamic` helps too. You may want to consider using `callgrind` and `kcachegrind` instead of `gprof` though. They provide much more information. – David Schwartz Aug 31 '12 at 22:12
-
or `gperftools`. note: `-g` is already there. – Karoly Horvath Aug 31 '12 at 22:17
1 Answers
0
I just checked gmon.out with gprof using command line instead of Eclipse and it appeared that there is no any ?? and 0xaddresses. So I assume that it is some kind of Eclipse viewer issue. Thanks for paying attention to this. I'll also try all tool that you suggested.
hasnobrains
- 109
- 6