I have the following plot
xleft<-c(1,2,3)
xright<-c(2,3,4)
ybottom<-c(1,2,3)
ytop<-c(2,3,4)

plot(c(1,4),c(1,4),type="n",main="title",xlab="site.x",ylab="ylab")
rect(xleft,ybottom,xright,ytop,col=c("blue","red","green"))
I would like to add rather long species names to both axes using these positions and labels
#Label position along  axes
x.label.position<-(xleft+xright)/2
y.label.position<-(ybottom+ytop)/2

#Labels
x.label<-c("Long species Name1","Long species Name2","Long species Name3")
x.label<-c("Long species Name4","Long species Name5","Long species Name5")
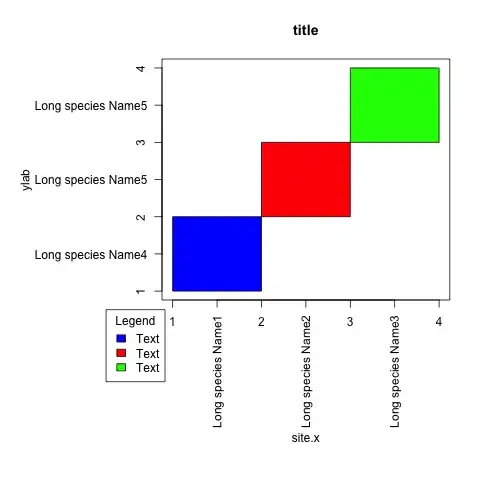
I would like to have the numerical axes, and axes titles left in place. I would also like to add a legend. So the final product would look something like this

What is the best way to go about this without having to clear the axes entirely using
par(xaxt = "n", yaxt = "n")
and adding text? Thanks for you advice.