4

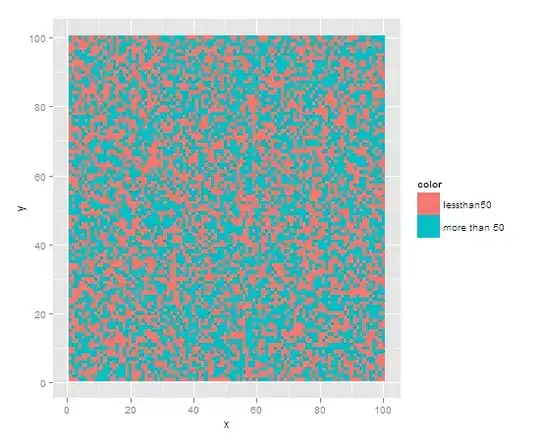
my matrix consists of values between 0 and 100 and has the dimensions of 100 x 100. I basically want to plot this matrix but colour all values above 50 in e.g. red and below in e.g. blue. On top of that I'd like to add a nice grayisch grid like they do it here with ggplot:

http://learnr.wordpress.com/2009/07/15/ggplot2-version-of-figures-in-lattice-multivariate-data-visualization-with-r-part-5/

I am wondering what's the easiest way to achieve that? I am not sure if I want to give ggplot a try as it looks pretty complicated from what I have seen so far. Isn't there any other easy plot function for such a task?

Richie Cotton
  • 118,240
  • 47
  • 247
  • 360
user969113
  • 2,349
  • 10
  • 44
  • 51

3 Answers3

6

In base graphics it is just:

image(x, col=c("red","blue")[1+(x>50)] )

To add the grid use:

grid(nx=100, ny=100, lty=1)
IRTFM
  • 258,963
  • 21
  • 364
  • 487
  • Also good way of doing it! thanks. However, I prefer the style of the ggplot2 package :-) It's pretty amazing, isn't it? :) – user969113 Aug 23 '12 at 07:51
5

I am not 100% sure if your data is in a matrix and you want a heatmap type plot. Or if it is in some other form and you want a scatterplot like those you link to. I just assumed your data is as described and that you want a heatmap. I imagine it is something like:

   x=abs(rnorm(100*100,50,25))
    x=matrix(x,nrow=100)

So I would reshape the data so it looks like xy coordinates with:

require(reshape2)
require(ggplot2)
x1=melt(x)
names(x1)=c("x","y","color")

Then I would make my cutoff into a factor:

x1$color=factor(x1$color>50)
levels(x1$color)=c("lessthan50","more than 50")

Then call ggplot with:

qplot(x, y, fill=color, data=x1,geom='tile')

enter image description here

Seth
  • 4,745
  • 23
  • 27
  • Woohoo excellent. that looks for now what I want! I just started to look into ggplot2 as from what I have seen in the last half an hour you can produce really cool and fancy looking plots! :) Thanks for that.Great work! – user969113 Aug 22 '12 at 22:40
0

You can do it simply enough with levelplot,

x <- abs(runif(100*100,0, 100))
x <- matrix(x,nrow=100)
levelplot(x, cuts=1, col.regions=c("red", "blue"))
Dan Bolser
  • 871
  • 1
  • 9
  • 17