13

Using ggplot2, I want to create a histogram where anything above X is grouped into the final bin. For example, if most of my distribution was between 100 and 200, and I wanted to bin by 10, I would want anything above 200 to be binned in "200+".

# create some fake data    
id <- sample(1:100000, 10000, rep=T)
visits <- sample(1:1200,10000, rep=T)

#merge to create a dataframe
df <- data.frame(cbind(id,visits))

#plot the data
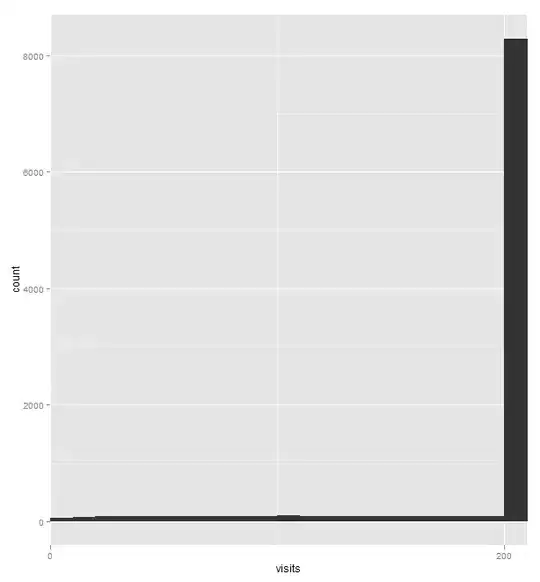
hist <- ggplot(df, aes(x=visits)) + geom_histogram(binwidth=50)

How can I limit the X axis, while still representing the data I want limit?

mikebmassey
  • 8,354
  • 26
  • 70
  • 95

2 Answers2

7

If you want to fudge it a little to get around the issues of bin labelling then just subset your data and create the binned values in a new sacrificial data-frame:

id <- sample(1:100000, 10000, rep=T)
visits <- sample(1:1200,10000, rep=T)

#merge to create a dataframe
df <- data.frame(cbind(id,visits))
#create sacrificical data frame
dfsac <- df
dfsac$visits[dfsac$visits > 200 ] <- 200

Then use the breaks command in scale_x_continuous to define your bin labels easily:

ggplot(data=dfsac, aes(dfsac$visits)) + 
  geom_histogram(breaks=c(seq(0, 200, by=10)), 
                 col="black", 
                 fill="red") +
  labs(x="Visits", y="Count")+
  scale_x_continuous(limits=c(0, 200), breaks=c(seq(0, 200, by=10)), labels=c(seq(0,190, by=10), "200+"))

enter image description here

Jojo
  • 4,951
  • 7
  • 23
  • 27
6

Perhaps you're looking for the breaks argument for geom_histogram:

# create some fake data    
id <- sample(1:100000, 10000, rep=T)
visits <- sample(1:1200,10000, rep=T)

#merge to create a dataframe
df <- data.frame(cbind(id,visits))

#plot the data
require(ggplot2)
ggplot(df, aes(x=visits)) +
  geom_histogram(breaks=c(seq(0, 200, by=10), max(visits)), position = "identity") +
  coord_cartesian(xlim=c(0,210))

This would look like this (with the caveats that the fake data looks pretty bad here and the axis need to be adjusted as well to match the breaks):

manual breaks on histogram

Edit:

Maybe someone else can weigh in here:

# create breaks and labels
brks <- c(seq(0, 200, by=10), max(visits))
lbls <- c(as.character(seq(0, 190, by=10)), "200+", "")
# true
length(brks)==length(lbls)

# hmmm
ggplot(df, aes(x=visits)) +
  geom_histogram(breaks=brks, position = "identity") +
  coord_cartesian(xlim=c(0,220)) +
  scale_x_continuous(labels=lbls)

The plot errors with:

Error in scale_labels.continuous(scale) : 
  Breaks and labels are different lengths

Which looks like this but that was fixed 8 months ago.

Cœur
  • 37,241
  • 25
  • 195
  • 267
mindless.panda
  • 4,014
  • 4
  • 35
  • 57
  • That's just about spot on. How would you update the x-axis labels if I wanted to add something like "200+". – mikebmassey Jul 23 '12 at 17:47
  • I think via `scale_x_continuous(labels=...)` but I'm not quite sure – mindless.panda Jul 23 '12 at 17:50
  • The error about unequal length of scales and labels goes away if you tell scale_x_continous what the breaks are, and don't rely on the scale to notice the breaks from geom_histogram: scale_x_continuous(breaks = c(seq(0, 200, by = 10), max(visits)), labels=lbls) – InColorado Oct 08 '21 at 22:44