I am having some problems in plotting this. Everything is ok until the plot statement where nothing plots. Can someone please help me so that it can plot something. The following is my code:
j = 10;
s = 0; r = 0;
B[n_] = Integrate[2*Sin[n*Pi*x]*(x), {x, 0, 1}];
u[x_, psi_] = Sum[B[n]*Sin[n*Pi*x]*Exp[-(n*Pi)^2*psi], {n, 1, j}];
K[x_, psi_] =
Sum[Sin[n*Pi*x]*
Sin[n*Pi*
psi]*(2*Exp[-(n*Pi)^2*
Abs[s + r]] - (Exp[-(n*Pi)^2*Abs[s - r]] -
Exp[-(n*Pi)^2*(s + r)])/(n*Pi)^2 ), {n, 1, j}];
w = RandomReal[NormalDistribution[0, 1], 101];
d = Round[100*x + 1];
S = Total[Total[u[x, psi]/Length[u[x, psi]]] + w[d]]
T[x_, psi_] = Integrate[K[x - y, psi]*(y)*S, {y, -10, 10}]
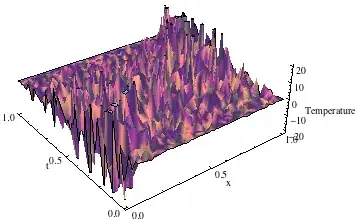
Plot3D[T[x, psi], {x, 0, 1}, {psi, 0.01, 1},
AxesLabel -> {"x", "t", "Temperature"}, Boxed -> False,
Mesh -> False]
Basically, I have some data from "u" and I want to make it noisy (from "w") for each "x" value and then perform the convolution in "T" and plot.
I will really appreciate anyone's kind help.
Thanks very much!