13

Imagine a cube-shaped piece of Swiss cheese. We model the cheese through a 20x20x20 grid. For simplicity, we assume that each grid cube consists entirely of cheese or entirely of air. On the upper side of our cube of Swiss cheese we then pour water, which penetrates the cheese only through the air holes in the cube. The water may flow through a continuous channel from the top to the bottom, but it may only flow from one air cube to the next, if the two cubes are connected through a face (not just an edge or a corner). The water can also flow on detours such as in a sink drain trap, but it may not flow out on the side walls of the cheese cube.

Now let us programmaticaly implement that model of the Swiss cheese with a random distribution of air and cheese cubes as described above, with the probability of cheese p and the probability of air 1 - p and simulate water flowing through the cheese in order to find out, whether the water flows through to the bottom of the Swiss cheese cube.

By repeatedly simulating water flowing throught the Swiss cheese cube with different probabilities of cheese and air we can ascertain a relationship between p and the probability of water flowing through to the bottom of the Swiss cheese cube, let's name it q. The result looks like this:

q
1   ************************
0.8                          *
0.6                           *
0.4                            *
0.2                             *
0                                 ***********
    0       0.2     0.4     0.6     0.8     1   p

My qustion: Why such a strange curve?

This question is taken from the 23rd federal competition of informatics in Germany (2004/2005). An answer to "why such a strange curve" has not been provided on the web (solutions provided).

I hope I'm at the right place with this sort of question.
borisdiakur
  • 10,387
  • 7
  • 68
  • 100
  • 9
    It's called percolation phase transition: http://en.wikipedia.org/wiki/Percolation_threshold. Explaining a theory of phase transitions takes books (http://www.amazon.com/s/ref=nb_sb_ss_i_2_14?url=search-alias%3Daps&field-keywords=critical+phenomena&sprefix=critical+pheno%2Caps%2C317) – ev-br Jul 01 '12 at 09:18
  • 1
    @Zhenya Precolation threshold - never heard that term before. That is a really useful piece of information, the one I was actually looking for. Although it's strange that the original competition assignment was to interpret the curve, so I guessed it should be possible to do that in the scope of an answer on stackoverflow. Thank you for pointing me into the right direction : ] – borisdiakur Jul 01 '12 at 12:49
  • It's an interesting question, but asking "why such a strange curve" is not relevant to StackOverflow. Asking how to model/simulate the problem would be. – Adrian McCarthy May 14 '13 at 15:42

2 Answers2

19

Maybe you'll find the following explanation intuitive:

In your case, 20*20*20 cells, unless you have at least 20 holes, the probability of water flow is exactly 0. If you have 20 holes, the water can flow if you order them in a column, but the probability that such an order appears randomly is very low, 20*20/Comb(20^3, 20) ~= 1e-57. As you increase the number of holes, appearance of contiguous paths becomes more and more probable.

When all your cells except 20*20 of them are holes, the only way to block the flow is to order all cheese cells into a single "blocking" layer, e.g. a horizontal 20*20 layer. (There are also other possible configurations, but none too probable. You need exactly one cheese block for every (x, y) coordinate and every cheese block must be in touch with all its (x, y)-neighbors. But they may be spread along the z-axis).

Once you have less than 20*20 cheese blocks, you cannot form a full layer and the flow probability becomes exactly 1.

Igor F.
  • 2,649
  • 2
  • 31
  • 39
  • That is indeed an intuitive explanation. Thank's for the aha-effect : ] – borisdiakur Jul 01 '12 at 14:09
  • That is a genius explanation of a complex phenomenon. – Novak Jul 01 '12 at 17:28
  • 2
    Don't want to sound like a smartass, but they condition that the 20x20 blocks shouldn't touch doesn't necessarily mean that they span a maximum of three layers. They could be diagonal for example, so they can span over all layers. – Shahbaz May 05 '13 at 13:58
  • @Shahbaz: You're right and I'm wrong. Maybe you could also give us the corresponding probabilities and how they influence the curve? – Igor F. May 06 '13 at 14:39
  • @IgorF. By all means, your explanation is great (and I'm not motivated enough to do the math myself), but I thought you may be interested in updating your answer with more accurate information. – Shahbaz May 06 '13 at 14:43
  • Ah, but if all your cheese was in one 20x20 slice, it would be an easy single, not a swiss cheese ;) (Just kidding of course, and great answer btw) – SmacL May 14 '13 at 13:26
3

This is an extension of the comment by Zhenya.

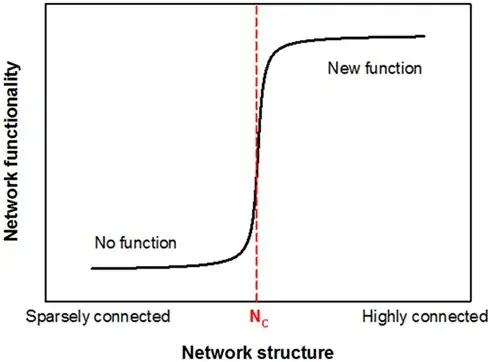
As mentioned, your Swiss cheese is an example of percolation theory. This is a fundamental concept of Statistical Mechanics when we consider the subject of phase transitions. One of the canonical examples of percolation theory is quite similar to the question you posted.

Erdős–Rényi model

In the Erdős–Rényi model, you start with an empty graph and connect the nodes with an edge with probability p. At some critical p value, the structure of the graph changes from a bunch of disconnected clusters, to one large spanning structure that contains a large fraction of the nodes. In fact, if you were to plot the average size of the largest cluster, you would get a very similar picture as your Swiss cheese model! Schematicly this looks like this:

enter image description here

and you'll find it in many examples in applied mathematics and physics. The credit to the picture comes from this article in Frontiers, which discuses this phenomena is much more detail.

Hooked
  • 84,485
  • 43
  • 192
  • 261