2

I would like to achieve a different colour gradient every time I add another a geom_line() to my main plot, each time with 'colour' as the scale. Here is a data frame just as an example:

df <- data.frame("letter"=c(rep("a",5),rep("b",5)),"x"=rep(seq(1,5),2),"y1"=c(seq(6,10),seq(6,10)/2),"y2"=c(seq(1,5),seq(1,5)/2),"y3"=c(seq(3,7),seq(3,7)/2))

For which I first plot:

y1 <- ggplot(df,aes(x=x,y=y1,colour=letter))+geom_line()
y1

I then would like to add y1 and y2, which I can do as follows:

y2 <- geom_line(data=df,aes(x=x,y=y2,colour=letter))
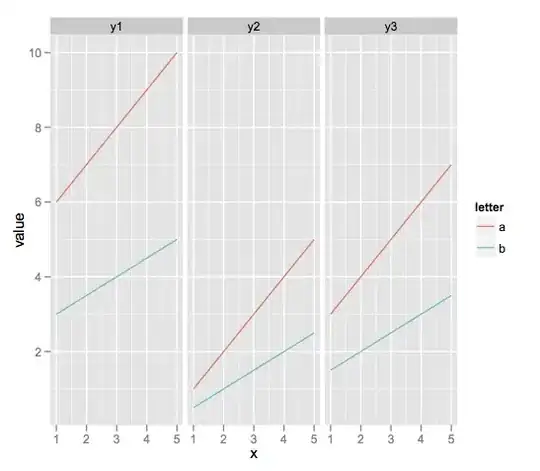
y3 <- geom_line(data=df,aes(x=x,y=y3,colour=letter))
y1+y2+y3

But I would like the colour gradient (or hue) to be different for y1, y2 and y3!

Is it possible to assign something like scale_colour_hue() to each geom_line, or is this only possible for the ggplot?

Thanks!

kohske
  • 65,572
  • 8
  • 165
  • 155
  • 2
    In a word, no, you can't. You can melt your data and (a) map color to a single variable that distinguished all six lines, or (b) use linetype or faceting to distinguish between the three pairs of lines. – joran Jun 25 '12 at 16:52
  • @joran, why not submit as an answer (not that you need the rep)? – Ben Bolker Jun 26 '12 at 08:55

1 Answers1

2

As I outlined above, here are some options:

df <- data.frame("letter"=c(rep("a",5),rep("b",5)),
                 "x"=rep(seq(1,5),2),
                 "y1"=c(seq(6,10),seq(6,10)/2),
                 "y2"=c(seq(1,5),seq(1,5)/2),
                 "y3"=c(seq(3,7),seq(3,7)/2))

# melt your data and create a grouping variable
library(plyr)                    
df_m <- melt(df,id.vars = 1:2)
df_m$grp <- with(df_m,interaction(letter,variable))


# Option 1
ggplot(df_m,aes(x = x, y = value)) + 
    facet_wrap(~variable) + 
    geom_line(aes(group = letter,colour = letter))

enter image description here

# Option 2      
ggplot(df_m,aes(x = x, y = value)) + 
    geom_line(aes(group = grp,colour = letter,linetype = variable))

enter image description here

joran
  • 169,992
  • 32
  • 429
  • 468