I have firebug installed and I can see on one of my 'Net' requests that there is a bit of 'blue' writing on the right hand side..... Im wondering what this is?

Im using mini-profiler.
I have firebug installed and I can see on one of my 'Net' requests that there is a bit of 'blue' writing on the right hand side..... Im wondering what this is?
Im using mini-profiler.
Blue links like these point to a line of relevant source code. You'll find them in various parts of Firebug.
For instance, similar links appear next to console log messages.
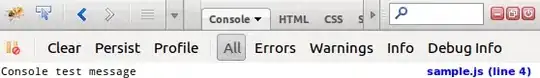
Clicking on such a link will show the line of JavaScript where console.log() was called.
Similarly, under the HTML Style sub-pane there are links to the relevant rules definitions in CSS files.

In your case, that blue link points to the line of JavaScript code on which an XMLHttpRequest was sent. Clicking on that link will display the line in question under the Script tab.
Though it seems that request was initiated from somewhere deep inside a minified copy of the jQuery library. Looking at that code won't be much help.
To understand what's going on you can click on the left margin of the request under the Net tab to set up a break point.
And on the next request of this kind, look at the stack trace to see which part of your code caused that request to happen.