TTR has some excellent TA indicators. Is there a package or function that calculates and charts different types of Support and resistance levels? Preferably a probability distribution for the likely support and resistance levels
Asked
Active
Viewed 4,932 times
4
-
There's the undocumented `TTR:::pivots` – GSee Jun 17 '12 at 14:42
-
Re: your edit, have you seen this type of thing (probability distribution of support/resistance) in the literature? Could you provide references/links? – GSee Jun 19 '12 at 19:51
-
I would like to be able to forecast the next local min and maximum from the previous historic local min and maxs with a degree of confidence included. – adam.888 Jun 20 '12 at 18:18
-
ref something like:http://rhinohide.wordpress.com/2012/05/27/boe-quantifying-catastrophe/#more-3004 – adam.888 Jul 03 '12 at 00:19
-
ref: http://grrrraphics.blogspot.co.uk/2012/05/ever-wanted-to-see-at-glance.html – adam.888 Jul 10 '12 at 12:01
2 Answers
5
Here's an example to follow up on my comment.
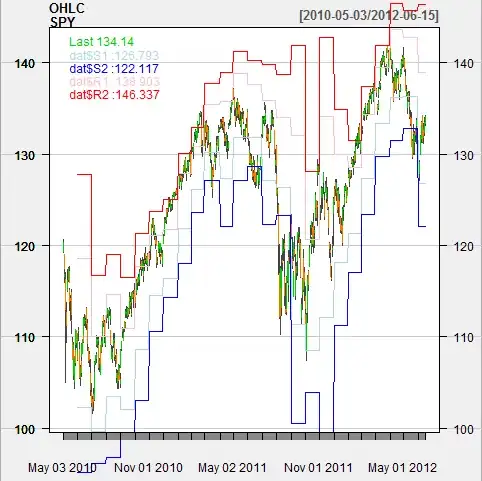
Calculate pivots using monthly data. Each month, use the Support and Resistance calculated from the previous month's data. (Of course, it doesn't have to be monthly pivots with daily data. You could use daily pivots, and an intraday price series)
library(quantmod)
getSymbols("SPY", from="2010-05-01", to="2012-06-15")
mSPY <- to.monthly(SPY, drop.time=TRUE)
# pivots() is excluded from the TTR build because it uses quantmod functions,
# but you can still get it from GitHub by running:
#source("https://raw.githubusercontent.com/joshuaulrich/TTR/master/R/pivots.R")
piv <- lag(pivots(mSPY, lagts=FALSE))
#merge, and fill forward pivot values so that there is a value for each day
dat <- cbind(SPY, piv)
dat[, 7:11] <- na.locf(dat[, 7:11])
chartSeries(OHLC(SPY), theme='white')
addTA(dat$S1, on=1, col='lightblue')
addTA(dat$S2, on=1, col='blue')
addTA(dat$R1, on=1, col='pink')
addTA(dat$R2, on=1, col='red')
That will produce:
Donchian Channels could also be seen as support and resistance
chartSeries(OHLC(SPY), theme='white')
dc <- lag(DonchianChannel(cbind(Hi(SPY), Lo(SPY))))
addTA(dc$low, on=1, col='blue')
addTA(dc$high, on=1, col='red')

Joshua Ulrich
- 173,410
- 32
- 338
- 418
GSee
- 48,880
- 13
- 125
- 145
-
28 June 2014: I tried the code above with the undocumented TTR:::pivots, but it failed. ` > piv <- lag(TTR:::pivots(mSPY, lagts=FALSE)) Error in get(name, envir = asNamespace(pkg), inherits = FALSE) : object 'pivots' not found ` – Doug Edmunds Jun 29 '14 at 00:24
-
@DougEdmunds It is [still there](https://r-forge.r-project.org/scm/viewvc.php/pkg/R/pivots.R?view=markup&root=ttr). Try installing TTR from R-Forge. You'll have to install xts from R-Forge first though. – GSee Jun 29 '14 at 01:07
4
Most of the technical analysis indicators in quantmod come from the TTR package, which I wrote. I did not include subjective indicators like support/resistance lines. That said, quantmod has an addLines function you can use.
library(quantmod)
getSymbols("SPY", from="2012-01-01", to="2012-06-15")
chartSeries(SPY, TA="addLines(h=c(134,141))", theme="white")
Which produces:
Joshua Ulrich
- 173,410
- 32
- 338
- 418