I m using zedGraph dll to save image of my graphs using points. Now I need to save a graphs with 1-X Axis and 3-Y axis. Also with 3-X axis and 1-Yaxis. Please help me out.
Asked
Active
Viewed 5,749 times
1 Answers
4
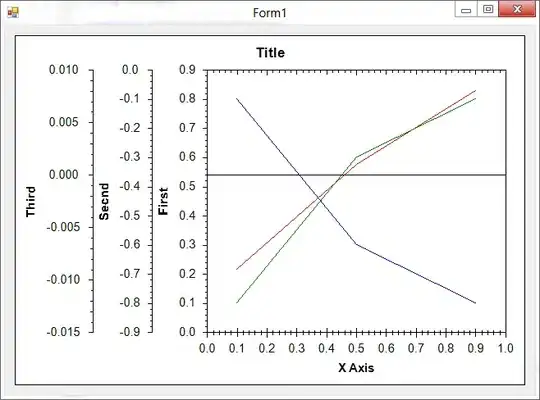
For the Y axis, this issue is fairly simple. Just add a sufficient number of YAxis objects to the GraphPane.YAxisList and associate the curves with respective axis by setting the YAxisIndex.
After adding all curves to the graph, update the scales of the Y axes by calling GraphPane.AxisChange().
Example:
var pane = zedGraphControl1.GraphPane;

pane.YAxisList.Clear();
var y1 = pane.AddYAxis("First");
var y2 = pane.AddYAxis("Secnd");
var y3 = pane.AddYAxis("Third");

var curve1 = new LineItem(null, new[] { 0.1, 0.5, 0.9 },
    new[] { 0.8, 0.3, 0.1 }, Color.Blue, SymbolType.None) { YAxisIndex = y1 };
pane.CurveList.Add(curve1);

var curve2 = new LineItem(null, new[] { 0.1, 0.5, 0.9 },
    new[] { -0.8, -0.3, -0.1 }, Color.Green, SymbolType.None) { YAxisIndex = y2 };
pane.CurveList.Add(curve2);

var curve3 = new LineItem(null, new[] { 0.1, 0.5, 0.9 },
    new[] { -0.009, 0.001, 0.008 }, Color.Red, SymbolType.None) { YAxisIndex = y3 };
pane.CurveList.Add(curve3);

pane.AxisChange();
will produce the following result:
For X axes, you would be able to have 2 different X axes by utilizing both the XAxis and X2Axis properties of the graph pane, and setting the IsX2Axis property to true for the curve that should reference the second X axis.
I do not know of a solution for more than 2 X axes, though.
Anders Gustafsson
- 15,837
- 8
- 56
- 114