I think your mental model of a heirarchy here is making this way too complicated. You don't have to subset by day and then by peak/off-peak. Just subset jointly.
Using ddply:
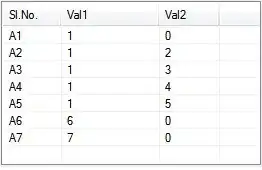
dat <- data.frame(date=rep(seq(5),5),time=runif(25),load=rnorm(25))
library(plyr)
dat$peak <- dat$time<.5
ddply(dat, .(date,peak), function(x) mean(x$load) )

> ddply(dat, .(date,peak), function(x) mean(x$load) )
   date  peak           V1
1     1 FALSE -1.064166845
2     1  TRUE  0.172868201
3     2 FALSE  0.638594830
4     2  TRUE  0.045538051
5     3 FALSE  0.201264770
6     3  TRUE  0.054019462
7     4 FALSE  0.722268759
8     4  TRUE -0.490305933
9     5 FALSE  0.003411591
10    5  TRUE  0.628566966
Using aggregate:
> aggregate(dat$load, list(dat$date,dat$peak), mean )
   Group.1 Group.2            x
1        1   FALSE -1.064166845
2        2   FALSE  0.638594830
3        3   FALSE  0.201264770
4        4   FALSE  0.722268759
5        5   FALSE  0.003411591
6        1    TRUE  0.172868201
7        2    TRUE  0.045538051
8        3    TRUE  0.054019462
9        4    TRUE -0.490305933
10       5    TRUE  0.628566966
And just for the fun of it, benchmarks
First, using 5x5 entries as above:
> microbenchmark(
+   ddply(dat, .(date,peak), function(x) mean(x$load) ),
+   aggregate(dat$load, list(dat$date,dat$peak), mean )
+   )
Unit: milliseconds
                                                 expr      min       lq   median       uq      max
1 aggregate(dat$load, list(dat$date, dat$peak), mean) 1.323438 1.376635 1.445769 1.549663 2.853348
2 ddply(dat, .(date, peak), function(x) mean(x$load)) 4.057177 4.292442 4.386289 4.534728 6.864962

Next using 500x500 entries
> m
Unit: milliseconds
                                                 expr      min       lq   median       uq      max
1 aggregate(dat$load, list(dat$date, dat$peak), mean) 558.9524 570.7354 590.4633 599.4404 634.3201
2 ddply(dat, .(date, peak), function(x) mean(x$load)) 317.7781 348.1116 361.7118 413.4490 503.8540
50x50 benchmarks
n <- 50
dat <- data.frame(date=rep(seq(n),n),time=runif(n),load=rnorm(n))
dat$peak <- dat$time<.5

library(plyr)
library(microbenchmark)
library(data.table)
DT <- as.data.table(dat)
m <- microbenchmark(
  ddply(dat, .(date,peak), function(x) mean(x$load) ),
  aggregate(dat$load, list(dat$date,dat$peak), mean ),
  DT[,.Internal(mean(load)),keyby=list(date,peak)]
  )
m
plot(m)
So aggregate is faster for small problems (presumably because it has less overhead to load up all the machinery), and ddply is faster for large problems (where speed matters). Data.table blows everything away (as usual).