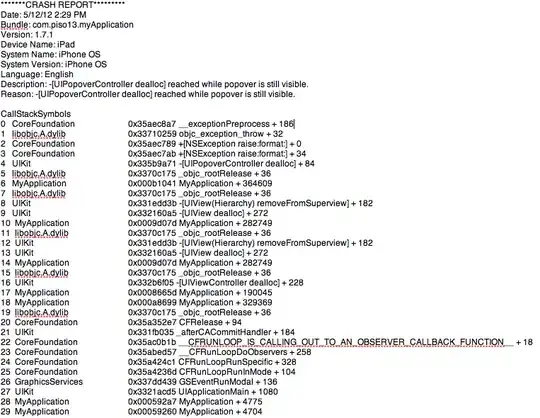
You get the symbolicated results, since your app binary contains the debug symbols, so calling callStackSymbols can resolve the addresses right away. The only missing part is the line numbers, which isn't possible to get automatically with the symbols being part of the app.
The three number values are: Address = Base Address + Offset. This means the first address is enough to get the symbol. The Base address is the start address of the binary/framework. Mostly when symbolication is done, the first address is also changed to be relative to the framework address instead of being absolute. The app binary memory area usually starts at 0x1000. This can be viewed in a crash reports binary images section, and it can be different to 0x1000 due to new memory features in newer iOS versions.
So for now simply use the give address in the 3rd column and add 0x1000 to the value when invoking atos.
In general I suggest using a framework based on PLCrashReporter, which will give you all information for a crash report. Including all threads and binary images in a standard crash report format and also works in the App Store.
