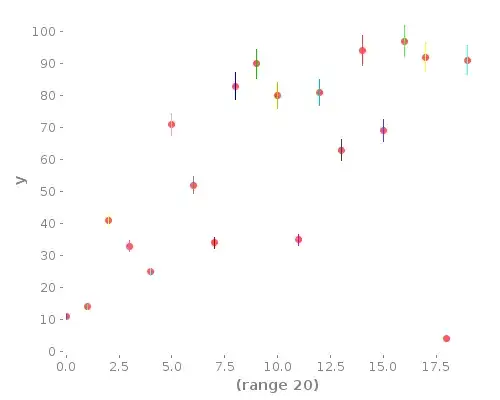
I'm creating a plot of a robot's belief of its distance to a landmark. The x-axis is number of measurements, and the y-axis is distance to landmark, which should include error bars to indicate the confidence in this estimate.
I haven't been able to find an good way to add error bars to the plot based off a value for the variance. Currently I'm creating a box-plot at each measurement by generating sample data about the mean with my value for the variance. This is clearly not ideal, in that it is computationally inefficient and is an imprecise representation of the information I'm trying to display.
Any ideas for how to do this? Ideally it would be on an xy-plot, and it could be done without having to resort to JFreeChart commands.