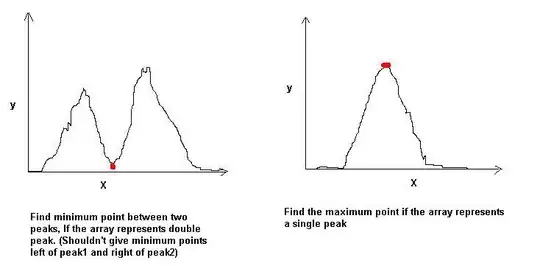
Here is one algorithm that might work depending on how noisy your signal is. Here I define a peak as the set of connected points greater than a given threshold value.
Assuming your original data is in the array A. First, find a threshold:
t = (max(A)+min(A))/2;
Next, find all the points greater than this threshold t:
P = A>t;
Count number of connected entries points that are greater than t using bwlabel
L = bwlabel(P);
numberOfPeaks = max(L);
Now numberOfPeaks should tell you how many peaks (connected points greater than the threshold value) you have in your data
Now to find the minimum point between the two peak we need to identify those points that seperate the two peaks using the label matrix L.
firstPoint = find(L==1,1,'last')+1;
lastPoint  = find(L==2,1,'first')-1;
So the valley between the first two peaks is the points with index between firsPoint and lastPoint. The minimum would then be
minValue = min(A(firstPoint:lastPoint));
Solution that does not depend on the Image Processing Toolbox
As @Nzbuu notes the aboth relies on the image processing toolbox function bwlabel. So, here is away to avoid that. First, I Assume that the the array P correctly identifies points belonging to peak (P(i)=1) and those belonging to valleys (P(i)=-1). If this is the case the boundary between peaks and valleys can be identified when dP = P(i+1)-P(i) = 1 or -1.
dP = diff(P);
To calculate the number of peaks simply sum the number of 1's in dP:
numberOfPeaks = sum(dP==1);
And the points identifying the first valley are between
firstPoint = find(dP==-1,1,'first')+1 %# the -1 represents the last point of the peak so add 1
lastPoint = find(dP==1,2,'first'); #% Find the start of the second peak
lastPoint = lastPoint(end); #% Keep the last value