65

I have a legend in a plot with a line (from an abline-statement) going through it. How can I achieve that the abline gets invisible in proximity of the legend? This should be achievable by setting the legend background white, without borders, but how can I achieve this? Assume the graph should look like this:

windows.options(width=30, height=12)
plot(1:10)
abline(v=seq(1,10,1), col='grey', lty='dotted')
legend(4.8, 3, "This legend text should not be disturbed by the dotted grey lines")

And to get it a bit more complicated: If the legend interferes with the dots of the dot-plot: How can I achieve that the ablines gets invisible in proximity of the legend (as above), but that the dots are still visible?

windows.options(width=30, height=12)
plot(1:10)
abline(v=seq(1,10,1), col='grey', lty='dotted')
legend(1, 5, "This legend text should not be disturbed by the dotted grey lines, but the plotted dots should still be visible")

And finally: Is there a way to introduce line-breaks in legend statements?
joran
  • 169,992
  • 32
  • 429
  • 468
biotom
  • 701
  • 1
  • 6
  • 8

2 Answers2

125

Use option bty = "n" in legend to remove the box around the legend. For example:

legend(1, 5,
       "This legend text should not be disturbed by the dotted grey lines,\nbut the plotted dots should still be visible",
       bty = "n")
TooTone
  • 7,129
  • 5
  • 34
  • 60
mayank
  • 1,251
  • 1
  • 8
  • 2
  • 3
    This is the right answer. It would be nice if the R documentation actually literally explained that the bty='n' will cause no legend box to be drawn. Instead it just says that 'n' is one of the options without explaining the effect of that option. I wonder if the R maintainers would allow someone like me to improve the standard documentation, such as this. – Geoffrey Anderson May 08 '14 at 15:34
  • 1
    @GeoffreyAnderson that *is* a massive issue with `R`: the docs are very poorly written. – Jim Aug 06 '18 at 11:57
  • @olala - bty so far as I understand means Box Type, so a Box Type of "n" is none. – Badger Jan 23 '19 at 21:28
28

As documented in ?legend you do this like so:

plot(1:10,type = "n")
abline(v=seq(1,10,1), col='grey', lty='dotted')
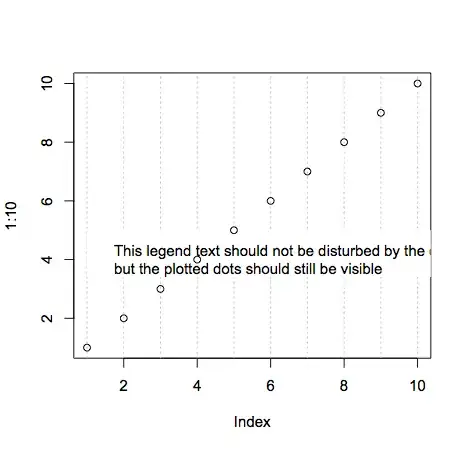
legend(1, 5, "This legend text should not be disturbed by the dotted grey lines,\nbut the plotted dots should still be visible",box.lwd = 0,box.col = "white",bg = "white")
points(1:10,1:10)

enter image description here

Line breaks are achieved with the new line character \n. Making the points still visible is done simply by changing the order of plotting. Remember that plotting in R is like drawing on a piece of paper: each thing you plot will be placed on top of whatever's currently there.

Note that the legend text is cut off because I made the plot dimensions smaller (windows.options does not exist on all R platforms).

joran
  • 169,992
  • 32
  • 429
  • 468
  • 2
    box.lwd=0 will work fine. bty='n' is probably better, because it means that legend box type is NONE at all. Both good answers! – Geoffrey Anderson May 08 '14 at 15:36
  • 3
    This is a better answer than bty='n' because it preserves the white bg, which is what the original question asked for. For the second point, where the legend covers the line but not the points, the only solution I can see is to add a points() command after the legend line. – slammaster Oct 20 '14 at 17:22