23

Climate change seems to polarise comment into denialists and believers. But good skeptics should be able to address specific issues with the data without falling into the anti-science denialist camp. Hence this question.

There is good historic evidence that the Medieval Warm Period was warmer than today (Greenland and much of Europe clearly were as the evidence from agriculture shows). But leading climate change scientists don't always agree (see the Wikipedia entry).

I'd say the world is getting warmer, but is it yet warmer than it ever has been in human history? What is the real evidence?

Sklivvz
  • 78,578
  • 29
  • 321
  • 428
matt_black
  • 56,186
  • 16
  • 175
  • 373
  • 3
    It's about heat transfer _rates_ too. Sure, there was a warm period that was several hundred years long. This period is only decades. It takes _time_ for quantities of ice to melt. Given all that I have seen we are indeed at the warmest time in recorded human history, but with out 6 second attention spans, and northern hemisphere winter coming on, most people will totally forget. – Larian LeQuella Sep 24 '11 at 17:07
  • 1
    I think the question would be better without the first paragraph, as it is the sort of thing which is likely to do more to polarise the discussion that bring it back to a more rational tone. It is possible to just discuss the science. The second two paragraphs pose the question very well (+1). –  Jun 19 '14 at 17:31

2 Answers2

24

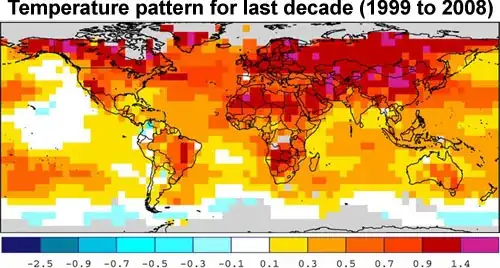
It is highly unlikely that the medieval warm period was, globally, warmer than current.

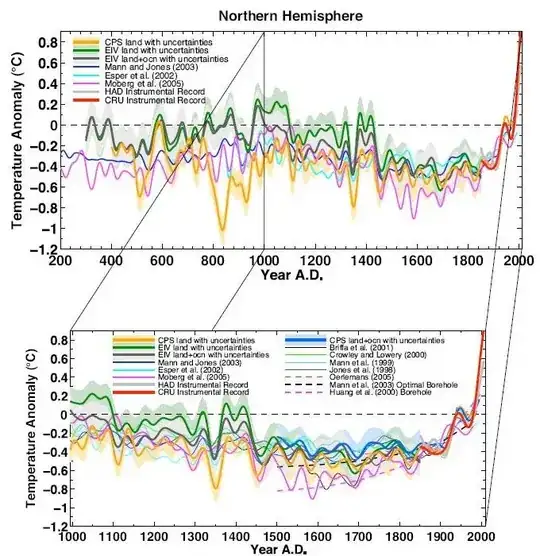
The IPCC 4th Assessment Report graphed a dozen different replications of the "hockey stick" graph, along with the instrumental record. This is for the Northern Hemisphere, which has both the best paleoclimate record and that's also where the various forms of historical evidence (such as the agricultural evidence and Viking settlements) are located. IPCC AR4 Figure 6-10

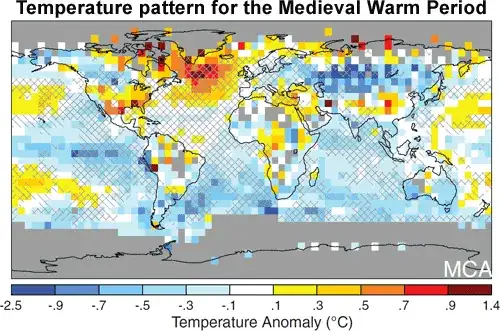
We can see from this that there are a few short patches in the 10th and 12th century which may possibly be warmer than today - it's just not very likely that they are. While most reconstructions do include a MWP that was slightly warmer than the temperatures around that period, it was probably not higher than the present-day average.

In addition, according to Mann et. al. (2008):

The reconstructed amplitude of change over past centuries is greater than hitherto reported, with somewhat greater Medieval warmth in the Northern Hemisphere, albeit still not reaching recent levels.

Mann et. al. (2008)

According to Surface Temperature Reconstructions for the Last 2,000 Years, a book written by the National Research Council:

Presently available proxy evidence indicates that temperatures at many, but not all, individual locations were higher during the past 25 years than during any period of comparable length since A.D. 900.

For interest, Ljungqvist (2009) plotted a number of paleoclimate proxies for a number of different regions. Remember, many of these will only include data up to about 1950 or so. In many of these records, current temperatures are lower than during their medieval warm peak. However, the exact time of that peak varies - which probably helps to explain why many locations contain a MWP and yet it is less pronounced in larger scale hemispheral or global records.

Jivlain
  • 6,658
  • 1
  • 37
  • 47
  • 4
    This is a very good summary of the conventional consensus. But the reason I asked the question in the first place was because some of the methods that built that consensus have been controversial (and are at the heart of the climate gate scandal). The historic evidence says medieval Europe was warmer (and the Ljunquist paper says "Late 20th century temperatures are in some of the records the highest for the last two millennia, although **more records** seem to show peak medieval temperatures exceeding the modern temperatures.") So do we trust the reliability of the consensus? – matt_black Sep 25 '11 at 16:34
  • 4
    One problem with these reconstructions is that they seem to severely understate uncertainty in the distant past. For example, in the third graph, uncertainty does not seem to widen as much further back in time as might be expected. Similarly in the fourth and fifth graphs, reconstructions which do show uncertainty often do not overlap: for example the CIV and EPS "land with uncertainties" bands are often highly distinct despite having been produced in the same paper. – Henry Sep 25 '11 at 17:29
  • @matt_black: That consensus is based on replicated studies. Whatever you may think of Climategate, the researchers who authored, say, the ECS02, or O05, or DWJ06 were not involved in it. You do have a good point about the Ljungquist paper, though, and I have edited my answer to include that. – Jivlain Sep 25 '11 at 22:21
  • @Henry: Note that the uncertainty bars are overlapping; in the case of the fifth graph, EIV land+ocean uncertainties is superimposed ontop of CPS land+uncertainties and EIV land+uncertainties. I think it also supports the case that the line with more data is between those two. You may like to see the supplemental information on that paper, which includes, amongst other things, individual plots of EIV and CPS so you can more clearly examine the uncertainty width. – Jivlain Sep 25 '11 at 22:52
  • Do we have the next 10 years worth of data? 10 years is a long time worth of recent history that's not included in the data above. Would be interesting to see. – going Sep 25 '11 at 23:22
  • @Jivlain: The spaghetti graphs are difficult to read, but on the reasonable assumption that the uncertainties are symmetric about the lines they relate to, it looks to me as if the yellow and green bands only substantially overlap regularly after about 1400. – Henry Sep 26 '11 at 00:16
  • 1
    @matt_black Here, on the SE site for *scientific* skepticism, we trust the *scientific* consensus by definition. – Sklivvz Sep 26 '11 at 00:35
  • 3
    @Sklivvz - with all due respect, scientific "consensus" can be invalidated by a single fact (would you like me to list the major examples?). The only thing I will trust is a reproducible research explaining the known facts by showing a controlled experiment producing the predicted outcome. You know, the whole "falsifyability" thing that some people like to have in real science. A backwards-looking model created by people who set out to prove a specific result doesn't qualify no matter how many people invested in status quo produce such models. None of the work **explains** MWP. – user5341 Sep 26 '11 at 21:05
  • 1
    @DVK: I think Stephen Jay Gould put it quite well: "I suppose that apples might start to rise tomorrow, but the possibility does not merit equal time in physics classrooms." It's possible that new evidence may come along contradicting the scientific consensus that the Earth revolves around the sun, but, as that has yet to happen, I'm going to go with what the evidence that exists, rather than the evidence that I imagine might exist in the future. – Jivlain Sep 26 '11 at 22:09
  • 1
    @Jivlain - uh huh. Evidence like the one OP asked about - you know, that agriculture and overall historic data indicates higher temperatures than now during MWP. Which your answer conveniently brushes off with a cite from Mann, of all people, based on reconstructions. In short: "My theory predicts that your data is wrong". Cue Proper Sherlock Holmes quote. – user5341 Sep 26 '11 at 23:28
  • 5
    @DVK Funny, I don't remember having contested the agricultural and historical evidence. Or having said anything about theory. I explicitly acknowledge the MWP. The data from Ljungqvist shows that such warm periods were not synchronous, and the data from Esper, Cook, Schweingruber, Oerlemans, D’Arrigo, Wilson, Jacoby and many others supports this. Better in short: "My large number of better-distributed data points adds context to this smaller number of data points, and improves our ability to compute accurate averages." – Jivlain Sep 27 '11 at 00:05
  • 1
    One of the things that would make the answer here much better would be a detailed discussion about the methods (especially the statistical ones) that are used to build paleoclimate reconstructions. It seems to me that one of the most cogent criticisms of the consensus (e.g. from McKitrick here http://www.uoguelph.ca/~rmckitri/research/McKitrick-hockeystick.pdf) is that some climatologists were careless with their methods if the methods produced the answer they wanted. Repeating what the consensus is doesn't help. – matt_black Sep 28 '11 at 17:04
  • 3
    @matt_black: M&M criticise the MBH98 paper, not cited above. Most of the above papers (where relevant) use different methods of statistical analysis to which such criticisms do not apply, and yet reproduce the results. – Jivlain Oct 03 '11 at 04:03
  • 1
    @jivlain Any chance of a summary of the techniques in a way that is easy to understand and would survive the sort of criticism M&M make? And do you know how many of the dendrochronology proxies have ever been updated beyond the 1980s? – matt_black Oct 03 '11 at 10:00
  • 1
    @matt_black: The details of the different methods of stastical analysis are way beyond my ken. M&M criticise the particular convention of "principal component analysis" (PCA) used in MBH98. [This](http://www.realclimate.org/dummies.pdf) may help. [Moberg](http://bit.ly/9wzxrQ), uses "wavelet transformation" instead of PCA at all. The [Rutherford](http://bit.ly/qpzfhE) paper, amongst others, uses the RegEM algorithm described [here](http://bit.ly/nP4H6b). My eyes glazeth over. But basically, it's different. – Jivlain Oct 03 '11 at 12:12
  • [This](http://www.ncdc.noaa.gov/paleo/data.html) site provides access to a number of paleoclimate data files. I'm not personally familiar with the data sets. I'll simply note that there are severe caveats on relying on dendochronology alone, especially for recent data (and that puts doubts on dendochronology historically, used alone). This seems a good time to point out that we're definitely well beyond the scope of this site, it might be better to move to chat or something for any further comment. – Jivlain Oct 03 '11 at 12:19
  • @matt_black Given the first paragraph of your question, it is a pity that you link to a paper that seems designed to polarise the discussion. Go to page 5, and you will find the famous Lamb diagram from the first IPCC report. McKitterick makes inflamatory statements such as "It is easy to see why this graph was a problem for those pushing the global warming alarm." and "Those wanting to “get rid of ”the MWP run into the problem that it shows up strongly in the data.". However McKitterick doesn't mention that the plot is not actually a plot of global temperatures, or that it isn't... –  Jun 19 '14 at 17:44
  • actually data, just a schematic drawing of what the the authors of the report thought were representative of global temperatures, based on Lambs analysis of Central England Temperatures. This is widely known (e.g. http://climateaudit.org/2008/05/09/where-did-ipcc-1990-figure-7c-come-from-httpwwwclimateauditorgp3072previewtrue/). Now this explains why it doesn't show a hockey stick, Lamb's diagram was from 1965, before the blade of the hockey stick actually existed, so it is no surprise at all it isn't in the diagram. –  Jun 19 '14 at 17:48
  • So why did the IPCC use the diagram? Simple, because in 1989, there were no multi-proxy paleoclimate data, because nobody had performed the analysis yet, so they had to make do with an (obviously) schematic drawing based on the CET data. MBH98 was one of the first such multi-proxy reconstructions, so it isn't unduly surprising that it had some methodological issues that have been dealt with in subsequent studies (which is how science works). It is a pity that the criticisms of that pioneering work are still being made against modern studies, which use much more developed methods. –  Jun 19 '14 at 17:51
  • Is there a version of these graphs without that CRU upswing at the end? It covers up the rest of the lines, which don't seem to show as pronounced a trend. – yters Jun 23 '14 at 00:42
1

From Mann (2009), using roughly 1000 different proxy datasets: enter image description here

Some recent temperatures via NOAA: enter image description here

So according to a comparison of these data sources, it all depends on the location and the scale you are looking at. Were temperatures during the MWP globally warmer than the modern warm period? Very likely not.

  • 4
    This would be totally convincing apart from two considerations. Mann's MWP world map doesn't look consistent with what we know of history (though written history is admittedly patchy). And Mann's proxy reconstruction methods are controversial (so using them as primary evidence here feels weak without some discussion of why his *methods* are unimpeachable). – matt_black Jun 21 '14 at 08:53