150

Benford's Law is a statistical rule that says that the distribution of digits in real-world numerical datasets tends to follow a specific pattern. It is often used to test whether an election is legitimate or phoney, by comparing the frequency of digits in candidates' vote counts to the expected pattern. For example, it was used in establishing electoral fraud in the 2009 Iranian election.

I recently came across several right-wing sources that claim President-elect Joe Biden's vote counts in the 2020 election violate Benford's Law. Examples include the website "The Red Elephants" and this r/donaldtrump thread. The "Red Elephants" article makes several other claims of fraud, but I would like to restrict this question to the digit frequency analysis. Normally I would immediately dismiss something like this as a baseless partisan conspiracy theory, but the claims should be testable using public records and statistical analysis. Quote:

According to some analysts, Biden’s Vote Tallies Violate Benford’s Law, as all of the other candidates’ tallies follow Benford’s law across the country, except for Biden’s when he gets in a tight race. Biden pretty clearly fails an accepted test for catching election fraud, used by the State Department and forensic accountants.

Analysts ran the data with Allegheny using the Mebane 2nd digit test with Trump vs Biden. The difference was significant. It just doesn’t work. Biden’s is fishy, many significant deviations. In Trump’s there were only 2 deviations but neither are significant at the 5% level. The X-asis is the digit in question, the Y-axis is the % of observations with that digit.

Here are a few of several relevant images from the article:

First digit frequencies in Chicago

First digit frequencies in Chicago

Second digit frequencies in Alleghany County, Pennsylvania

Biden second digit frequencies in Alleghany

Trump second digit frequencies in Alleghany

Oddthinking
  • 140,378
  • 46
  • 548
  • 638
Jacob Hoffman
  • 971
  • 2
  • 5
  • 4
  • 120
    I'm having issues accessing the Reddit link, so just to clarify: Is the claim that Benford's law is violated by Biden/Harris in a significant number of counties nationwide, or only in a few? With [over 3,000 counties in the United States](https://www.usgs.gov/faqs/how-many-counties-are-united-states?qt-news_science_products=0#), I'm sure *some* would be expected to violate the law for any given ticket - so *some* is a different claim than *many*. Also, I notice that the two plots at the bottom have different y-axis limits - some disingenuous data visualization by someone. – HDE 226868 Nov 07 '20 at 17:29
  • 7
    Surely the official vote counts in especially lPennsylvania are not released yet where are the data from? – mmmmmm Nov 07 '20 at 17:30
  • 18
    Until the full vote totals are in/certified/etc., this seems like an 'unresolved current event': we can't say if the final result's digits follow Benford's law until we know for sure what the final result's digits are. Finding a few outliers when looking at a snapshot of numbers that are steadily increasing doesn't really say much. – Giter Nov 07 '20 at 17:50
  • 18
    We require questions on this site to be about widely-believed ("[notable](http://meta.skeptics.stackexchange.com/questions/882/what-are-the-attributes-of-a-good-question/883#883)") claims. Some users confuse that with claims coming from sources that they consider reliable. The source of this question's claim might not be considered reliable, but they are widely read. I have deleted comments that insist on reliable sources for this question. (Answers, of course, should use reliable sources.) – Oddthinking Nov 08 '20 at 01:00
  • 92
    "It is often used to test whether an election is legitimate or phoney [...] it was used in establishing electoral fraud in the 2009 Iranian election." This is not a fair summary of the Wikipedia page linked, which includes a quote from a paper that explains "Benford’s Law is essentially useless as a forensic indicator of fraud" for elections. I would argue that one person used it to *allege* fraud in 2009 Iranian election, rather than establish it. – Oddthinking Nov 08 '20 at 01:09
  • 1
    Researchers like Meban try to apply Benford's Law (and using second digits) and they deviations everywhere. They conclude that this means fraud does not actually exist and that what they are actually seeing is a good election strategy (i.e. get-out-the-vote campaigns, etc). This is totally unclear since it has been alleged by many very senior ex-poliiticians (like Blagojevich) have actually claimed that fraud is extremely widespread, really endemic. – Charles Nov 08 '20 at 14:53
  • 2
    @Giter Analyzing sub-totals or "votes so far" should be fine. The issue is whether "announced" numbers are real, or made-up. The more to analyze, the better, as long as no cherrypicking. If I claim 472,581 facebook pals, it's suspicious. If I supply #'s for the past 10 days, broken-out by continent, with no repeats or consecutive #'s, they're almost for sure made up. – Owen Reynolds Nov 08 '20 at 17:00
  • 2
    I don't have time to put this into a real answer right now because I need to get ready for work, and this site frowns on quoting someone else's work wholesale, so https://twitter.com/gelbach/status/1324760993692590081 – Shadur Nov 09 '20 at 06:46
  • 5
    The most interesting issue here is, that Benfords law can show only one fraud type, which is fabricating numbers. Something which is very unlikely in a distributed voting system (under the trump administration). What’s more likely is voter suppression or counting clerks stretching rules for signatures or valid forms to their preferred political party. Those effects do not result in „fabricated“ totals. – eckes Nov 09 '20 at 07:14
  • I love how they claim a statistical test is insightful here, but then don't compute e.g. a p-value, instead just saying the chart looks off by a lot by eye. – J.G. Nov 09 '20 at 15:24
  • 2
    The key issue I'd want to see addressed is the number of simultaneous hypotheses being tested. An observation is often said to be "significant" if there is a 5% chance it happened by chance, so if you look at 20 regions, one of them will show significant deviation from the expected pattern. Also note that if the deviations were in Trump's numbers but not Biden's, the conclusion drawn would be the same, because there's nothing in the data showing which candidate would be helped by the "fake" numbers. – Mike Serfas Nov 09 '20 at 16:57
  • @Charles of course a guy like Blagojevich has a vested interest in saying that everyone does things like what he did – llama Nov 09 '20 at 17:19
  • I see different charts in the redelephants article: first-digit distributions are for Milwaukee and Allegheny rather than Chicago, the second-digit chart is about absentees and has no axes alterations. Did the article change in the meantime? – KT. Nov 10 '20 at 11:24
  • @Shadur: We frown on plagiarism, but that's solved by showing your sources. We are wary of looong passages being quoted; better to summarise and provide a link. But this seems a legit (albeit not peer-reviewed) source . – Oddthinking Nov 10 '20 at 11:48
  • 1
    Related: Benford's law and voting in Georgia https://math.stackexchange.com/questions/3902008/benfords-law-and-voting-in-georgia – Henry Nov 11 '20 at 01:34
  • @oddthinking Oh, good, she wrote a more cogent article over to medium.com. I've cited that extensively in my answer. – Shadur Nov 11 '20 at 07:28
  • For comparability, I ran the data from 2016 Chicago and the results look the same for Clinton/Trump. So, unless Clinton benefited from the same "fraud" I'd chalk it up to some of the good explanations provided in this post. I'd be interested to see how 2016 looked in Pennsylvania where she lost... – lionz Nov 11 '20 at 17:33
  • As a note, the Allegheny data would perhaps be better served by plotting both lines on a single graph, with a Y axis going from either 7 or 7.5 to 12.5 in increments of 0.5. This would prevent faulty interpretations due to differing Y-axis scales and make direct comparison easier, without altering the data itself. – Justin Time - Reinstate Monica Nov 12 '20 at 00:47
  • What is "N" in the charts? Is it precinct-level vote counts? – adam.r Nov 13 '20 at 01:14

8 Answers8

441

This answer only addresses the second charts. I'll let Mathematician Matt Parker address Benford's Law.

I can confirm [the result is] actually exactly what you'd expect, that's not out of order... And secondly Benford's Law is not a good test for election fraud. And I quote [from Benford's Law and the Detection of Election Law (2011)] "Benford's Law is problematic at best as a forensic tool when applied to elections".

To the graphs, the vertical scales are different. Narrow vertical scales make changes look larger. While wide vertical scales smooth out changes. Biden's graph is using a more narrow scale than Trump's.

I put them all together in one graph with the same scale and they don't look so different anymore.

Redrawn Graph

I haven't verified the data from the original graph is correct. I had to eyeball the numbers from the graphs.

It is suspicious because someone had to choose to use different vertical axes for each graph. It looks like a case straight out of How To Lie With Statistics.

Schwern
  • 17,034
  • 7
  • 63
  • 66
  • Comments are not for extended discussion; this conversation has been [moved to chat](https://chat.stackexchange.com/rooms/116079/discussion-on-answer-by-schwern-do-vote-counts-for-joe-biden-in-the-2020-electio). – Oddthinking Nov 11 '20 at 03:47
  • @Oddthinking Thanks for the touch up. [Matt Parker](https://en.wikipedia.org/wiki/Matt_Parker)'s video does a really good job of addressing the full question. Should I add a section to this answer to provide more detail? Do it in a second answer? Or leave it as a link? – Schwern Nov 11 '20 at 06:42
167

Disclaimer: I have not looked at the actual data.

In general, the biggest problem with applying Benford's law to district level election data is, that precincts are usually small and similar in size. For example, if all the precincts have around 800 voters and one candidate consistently takes 40-50% of votes, then it is expected, that the most frequent first digits will be 3 and 4.

Benford's law works better in cases where the values span multiple orders of magnitude, which is not the case here.

For concrete examples, it is worth looking at the several Github issues on the source of the analysis:

The disappearance of Benford's law in Milwaukee is a function of voter preference alone. If one candidate has between 60% and 80% average chance of receiving a vote, then the sizes of the wards in Milwaukee are too small to accommodate Benford's law.

More generally, several papers question the usefulness of Benford's law applied to election data:

Does the Application of Benford's Law Reliably Identify Fraud on Election Day?

Unfortunately, my analysis shows that Benford's Law is an unreliable tool. And, as one applies more sophisticated methods of estimation, the results become increasingly inconsistent. Worse still, when compared with observational data, the application of Benford's Law frequently predicts fraud where none has occurred.

Benford's Law and the Detection of Election Fraud

It is not simply that the Law occasionally judges a fraudulent election fair or a fair election fraudulent. Its “success rate” either way is essentially equivalent to a toss of a coin, thereby rendering it problematical at best as a forensic tool and wholly misleading at worst.

BKE
  • 1,520
  • 1
  • 12
  • 20
  • If the tool is not very reliable, is it being used by the State Department, and should it be? – Andrew Grimm Nov 07 '20 at 22:06
  • 10
    @AndrewGrimm I have no idea, wasn't part of the question. Either edit the question adding references to claims that it should be used, or ask a new question. – BKE Nov 07 '20 at 22:34
  • @AndrewGrimm the question says it is used by the State Department, and not what for. How reliable it is depends on what it is used for and in what context. – Cryvate Nov 08 '20 at 01:24
  • A complete answer would look at this data and compare it specifically to the median number of votes (per candidate) in the "precincts". Additionally, the spread of "number of votes" in each precinct is important. – Steven Sagona Nov 08 '20 at 04:03
  • 3
    "For example, if all the precincts have around 800 voters and one candidate consistently takes 40-50% of votes, then it is expected, that the most frequent first digits will be 3 and 4." To follow up on this: if one candidate trails behind in a lot of precincts but dominates in a few others - say, takes from a range of 25-95% of votes - then that will produce a wider spread of first digits, but still tending to avoid 1 (for these numbers). Whereas the other candidate would have a spread of 5-75%, thus having results that span more than an order of magnitude, making the law hold better. – Karl Knechtel Nov 08 '20 at 05:42
  • 3
    You can reduce the scale of the data needed to apply Benford's law by using a smaller logarithm (i.e. instead of base 10, what if we did base 5?). I'm curious to see the same analyses applied in these cases too. – Anon Nov 08 '20 at 09:25
  • @StevenSagona Chicago votes per precinct: mean 516, median 491, standard deviation 173. Biden/Harris votes: mean 424, median 403, standard deviation 152. Trump/Pence votes: mean 83, median 61, standard deviation 80. – Henry Nov 08 '20 at 14:14
  • 1
    @AndrewGrimm, you need to group data into batches of varying size to apply Benford's law. For example, if you group the results on the state level rather than the precinct level, the leading digits follow the law reasonably well. – Mark Nov 08 '20 at 18:40
  • 7
    Chicago also provides the same data for previous elections. we see the same pattern in 2016. Moreover, I did the same analysis for the German federal elections 2017 and there Benford's law (1st digit) is simply not applicable at least for the major parties. I guess, this also relates to precincts having roughly the same size. – Quickbeam2k1 Nov 08 '20 at 19:01
  • @Henry. Okay, well then next, someone would have to compare this distribution with previous distributions in the past. That is, the assessment that benfords law doesn't imply fraud is assuming that it is believable that this even distribution of votes is believable. So the next step would be to evaluate how likely this is. (For instance maybe the sizes of the precincts are actually very different and the actual turnout is very different between precincts.) – Steven Sagona Nov 08 '20 at 19:14
  • @Anon Yes, but that will then defeat the whole purpose of the analysis. If there is fraud it is because people have been editing the data and people will end up doing that in a way that is statistically unnatural. But if you then transform such edited data to another base, the digits will end up being randomized and Benford's law will reappear again. – Count Iblis Nov 09 '20 at 10:27
  • 3
    This answer gets to the heart of the question, but it may also be worth adding that it is pretty common for observed digits to not follow the Benford's Law distribution exactly. But if that's the standard that you want to use then comparing levels of conformity doesn't make sense. The Biden-Harris Benford graph isn't particularly Benford-conforming, but neither is the Trump-Pence graph. If neither conforms, then neither is really "better" than the other. And that's assuming that Benford applies well to vote counts, which as in the answer is unclear. – Upper_Case Nov 09 '20 at 18:07
  • And yet the votes in all other races match Benford's law reasonably well. It is interesting and suggestive that it is only the Biden/Kamala votes that deviate so markedly from it. – DrMcCleod Nov 10 '20 at 12:02
  • 1
    @DrMcCleod As Henry's answer points out, only Trump's votes match it very much; all the other third party candidates had a leading digit of zero in hundreds of precincts. You can almost always find suggestive in a small enough set of examples, especially when cherry-picking data; the first thing I would do when thinking about such a theory is to work with the ten elections preceding this, and see if the rule held for previous presidents. – prosfilaes Nov 11 '20 at 07:19
  • @anon I did the numbers for milwaukee with base5 and it works for trump, not for biden. The problem with base 4 is that you only have 4 data points. – Peter Turner Nov 12 '20 at 23:49
89

Looking at the actual Chicago data at https://www.chicagoelections.gov/en/election-results-specifics.asp by precinct as of late November 7, the charts for Chicago look credible but the assumption that Benford's law should apply do not, at least for Biden/Harris or the minor candidates.

Of the 2069 precincts (most of which are of broadly similar size), Biden/Harris won fewer than 100 votes in 12 precincts, and more than 999 votes in 4 precincts. All the rest (more than 99%) had three digits for their votes, violating the requirement that natural data satisfying Benford's law should span several orders of magnitude. More than half the precincts (1100) gave Biden/Harris from 300 through to 499 votes, making 3 and 4 the most common first digits (the chart reflects this and is close to showing the actual frequencies by hudreds of votes, so 300-399 was the most common).

For Trump/Pence, votes were more widely dispersed: 99 precincts with 1-9 votes, 1339 precincts with 10-99, and 633 precincts with 100 or more votes. This dispersion over orders of magnitude allowed a greater chance of coming closer to matching Benford's law.

For the minor candidates, they only reached double digits in a very small number of precincts (and got 0 votes in hundreds of precincts - not shown on the charts) so the charts are close to showing their actual vote distribution with censoring of 0 and 10+; again you would not expect Benford's law to apply.

Chicago was an odd choice to investigate for suspected cheating in 2020 where the gap in Illinois was 12 percentage points (1960 when it was 0.2 percentage points might have been more interesting). I suspect it was chosen simply because the data is publicly available and the distortions caused by similar precinct size led to this non-Benford law result. You will see this elsewhere for similar reasons: in 2019 very few British MPs won a number of votes starting with 5-9, as their constituencies are of broadly similar sizes and the winners usually got in the range from 10,000 to 49,999 votes, again failing the spanning several orders of magnitude requirement.

Henry
  • 13,472
  • 1
  • 54
  • 62
  • 8
    That's a good explanation, though not entirely accurate: There is no requirement for spanning several orders of magnitude, and Benford's Law can be observable even when there is not a wide span of magnitudes. If there is a wide span, Benford's Law tends apply more accurately, but it's not a requirement. What's required is that there not be a cutoff of possible leading digits (a bounding requirement). – user3570982 Nov 08 '20 at 04:01
  • 17
    @user3570982 Not having multiple orders of magnitude is a (soft) bounding of possible values in itself. – SomeoneSomewhereSupportsMonica Nov 08 '20 at 11:33
  • 1
    @SomeoneSomewhereSupportsMonica That's not really true. Look at the example provided in the Wikipedia article referenced: https://en.wikipedia.org/wiki/Benford%27s_law#Example . Regardless of units used, building heights in that example differ by only one order of magnitude, and in the case of meters, only 5/58 buildings are less than 100m, yet Benford's Law applies -- it's the example used, after all. Spanning multiple magnitudes is not a requirement, it's a rule-of-thumb for judging accuracy, but it's a rule that is highly context dependent. – user3570982 Nov 08 '20 at 13:33
  • 3
    @user3570982 - except that that example does not fit Benford's law since the pattern of heights in metres does not match the pattern of heights in feet. "1 is by far the most common leading digit" may be true in that particular example in metres and feet, but it would not have been true for example a scale of half-metres (3 would appear more often as the first digit than 1); the overall Benford distribution does not match that data at any scale. – Henry Nov 08 '20 at 14:04
  • @user3570982 What you've said is literally the opposite of what is written in the reference article. I'll fully quote: "Examining a list of the heights of the 58 tallest structures in the world by category shows that 1 is by far the most common leading digit, irrespective of the unit of measurement (cf. "scale invariance", below)". Instead, you've illustrated exactly what is true: requiring a span across multiple magnitudes tends toward accuracy, but that's a rule of thumb that is *context dependent* – user3570982 Nov 08 '20 at 14:11
  • 6
    @user3570982 You have quoted the article accurately, but that part of the article is simply wrong. The prevalence of the leading digit 1 is dependent on the unit of measurement. For some choices of a unit (e.g. feet, meters) 1 is most common; for other possible choices of a unit, it is not. Henry gave a counterexample disproving the article's claim. The claim is "almost true", because this particular set of data span almost exactly one order of magnitude and are mostly evenly distributed logarithmically (though with a notable peak around 175 m). – David K Nov 08 '20 at 15:46
  • @David K I should have taken the time to fully read what Henry was writing, rather than focus on the partial quote. My bad. What you've written, though, doesn't "disprove" the application of Benford's Law to the example dataset given. From https://mathworld.wolfram.com/BenfordsLaw.html , "Benford's Law applies to data that are not dimensionless, so the numerical values of the data depend on the units." That is, scale invariance is not a requirement for applying the analysis, but when unit dimensions are included, the specific context matters. (continued)... – user3570982 Nov 08 '20 at 16:10
  • @David K This illustrates a potential context dependency of applying Benford's Law itself, which is, I believe, the primary thrust of what Henry originally wrote. However, that still does not mean that the contention that multiple spans of magnitude in the dataset being analyzed is a requirement for Benford's Law, is accurate. It is not. It's possible that applying Benford's Law to voter precincts may not be applicable for contextual reasons, but the primary reason given to reject its application (magnitude spans) is not actually disqualifying. – user3570982 Nov 08 '20 at 16:17
  • 5
    @user3570982 I think Henry's point is that while data not spanning multiple orders of magnitude *can* follow Benford's Law--as the heights would have, if a few between 160 and 190 m had been left out of the list--there is no reason to *expect* them to. The main claim we are discussing here is the predictive power of Benford's Law to election results. It is not looking good for that. – David K Nov 08 '20 at 16:37
  • 1
    @user3570982 While spanning multiple orders may not be required, a scale-invariance is (as in measuring in feet vs. meters when the units are unrelated to the observables). With precinct sizes *roughly* the same, we are but much closer to a Bernoulli situation. If you cook a large pot of lentil soup and distribute is to same-size-ish plates, then the number of lentils per plate will *not* be Benfordian – Hagen von Eitzen Nov 08 '20 at 21:54
  • @Hagen von Eitzen That's not accurate: scale invariance is sufficient for Benford's Law to apply, but it is not necessary. Also, your example actually seems to illustrate the general contention. If you don't constrain the amount of lentils per plate, you'll see a Benford distribution; if you do, you won't. Incidentally, that's exactly why Benford's Law is claimed to suggest election fraud: if you don't constrain the amount of votes a candidate receives, you should see a Benford distribution; if you do constrain (that's the fraud part), then the distribution won't match Benford's Law. – user3570982 Nov 09 '20 at 02:47
  • @user3570982 Your claim is within striking distance of one that is verifiably incorrect. If we specify Hagen's example a bit more to impose that "same-size-ish" means that it is normally distributed about a mean with a standard deviation of, say, 10% (which seems reasonable for eyeballed pasta), then the vast majority of the distribution will be in one order of magnitude, and you will probably be able to see the specific mean on the distribution. There will be a bell curve around some number (perhaps you can argue that this mean is itself benford distributed, but it is where it is). – Mario Carneiro Nov 09 '20 at 17:29
  • 1
    @Mario Carneiro I agree. If you constrain the lentil servings to be "same size-ish" then you shouldn't see a distribution consistent with Benford's Law... because you constrained the serving size. Any time you add constraints like that, you're necessarily skewing the dataset. If you open servings sizes to sizes that are outside of "same size-ish," Benford's Law should emerge. Similarly, if you constrain precinct vote tallies, you'll also see something other than Benford's Law... which is the point. Note, I'm not saying that deviating from Benford's Law proves a constraint (fraud). – user3570982 Nov 09 '20 at 17:47
  • 1
    Look, I'm not saying that, because Benford's Law isn't always observable with Biden, that fraud took place, or even that Benford's Law properly applies to precinct totals. What I've pushed back on is the misapplication of rules that aren't always applicable. Benford's Law does not require scale invariance or multiple magnitude spans for datasets being analyzed. Insisting that those are requirements is just flat out wrong. I get that, for many, this is really a political argument, but doubling down on falsehoods is certainly outside of what I'd consider skeptical reasoning. Anyway, gotta work. – user3570982 Nov 09 '20 at 17:59
  • 1
    @user3570982 not spanning at least an order of magnitude means that it was restricted. Maybe that restriction is natural (the number of kids people have is not Benfordien but the data certainly hasn't been tampered). The number of lentils in a soup bowl has also not been tampered with, it's just a natural consequence of people filling the bowl to roughly the same place. If a set of numbers naturally have a tight (less than an order of magnitude 6 sigma) distribution it will not be Benfordian. Then the question remains of whether voting naturally has a tight distribution. – Rick Nov 09 '20 at 21:20
  • 1
    What Rick said. And moreover, it's not just whether voting in general has a tight distribution, but whether voting in chicago districts are tightly distributed, where there is apparently a good reason for them to be so, namely that the districts are all about the same size (and also politics is not uniformly distributed in any sense). I would stand by the claim that multiple magnitudes are a *necessary* condition for a benfordian distribution, or at least, I see no a priori reason to believe that a tightly distributed RV should be benfordian. – Mario Carneiro Nov 10 '20 at 20:10
  • @user3570982 As for scale invariance, that's not a requirement of the benford distribution, it is a property of the benford distribution. It doesn't really make sense to say that an RV is itself scale invariant because a given RV has a mean and that mean changes if you scale the variable. But if it is benford distributed then a scaled version of the variable will also be benford distributed. – Mario Carneiro Nov 10 '20 at 20:16
21

According to Wikipedia:

Benford's law, also called the Newcomb–Benford law, the law of anomalous numbers, or the first-digit law, is an observation about the frequency distribution of leading digits in many real-life sets of numerical data. The law states that in many naturally occurring collections of numbers, the leading digit is likely to be small.
...
It tends to be most accurate when values are distributed across multiple orders of magnitude, especially if the process generating the numbers is described by a power law (which is common in nature).

Beford's Law is not some universal phenomenon, and it failing to hold is not "proof" of fraud. For instance, we can play this game with the vote percentages that Donald Trump received in 2016: 11 first digit of 3, 19 first digit of 4, 16 first digit of 5, 9 first digit of , and 1 first digit of 7 (yes, this adds up to 56; some states don't assign electors based on state-wide totals, and there's also DC). Clearly, Trump's vote percentages were fraudulent! In the reddit thread, u/Three-Twelve says

In the case of the Milwaukee data and Detroit cited in the pictures above, the number of votes per voting area does not span over several orders of magnitude, so Benford's Law is not applicable.

The size of a precinct is likely a stronger predictor of the number of votes for Biden, than Biden's support is. If these people want to claim that this is evidence that the number of voters per precinct is not random, that would be more supported by the evidence, but also much more vacuous (it's hardly earth shattering news that some precinct sizes are preferred over others).

The amount by which a candidate's level of support predicts their vote count, compared to how well precinct size does, will increase the more that level of support varies (as a percentage of that support). Thus, if Biden's support varies between 90% and 95%, and Trump's varies from 5% to 10%, Biden's support is varying by a bit more than 5% (the math is a bit confusing, as this is a percentage of a percentage; 5% is a bit more than 5% of 90%), and Trump's support is varying by 100% (5% is 100% of 5%). So Trump's vote totals will vary more than Biden's, and thus Trump's totals will have more variance across orders of magnitude, and Beford's Law will be more applicable (note that Jo Jorgensen, who has even less support than Trump, has a distribution that is also closer to Benford). For an apples to apples comparison, we'd want to compare to places where Trump was the favored candidate, but those are rural areas, and I would expect precinct sizes to vary more in rural areas than in cities.

The Wikipedia article further says:

Based on the plausible assumption that people who fabricate figures tend to distribute their digits fairly uniformly, a simple comparison of first-digit frequency distribution from the data with the expected distribution according to Benford's law ought to show up any anomalous results.

Biden's distribution is consistent neither with Benford, nor with a uniform distribution. It is, however, a very good fit for a Poisson or lognormal distribution.

Whenever you have a statistical analysis, it's important to remember that the what it can tell you is that the observed data is unlikely given your null hypothesis. Going from that to that the null definitely is false requires further justification, and assuming that because the null is false that means that your favored alternative is true is a false dichotomy. If someone has a model in which this voting data is unlikely, all that is an argument for is that their model is false. Democrats engaging is fraud is just one possible way the model could be false.

Acccumulation
  • 2,873
  • 1
  • 14
  • 19
  • 2
    Where are your Trump numbers from. Citing a Reddit commenter as an authority seems rather weak. The middle part of the analysis needs references; we have no reason to trust you as an analyst. Who says Biden's distribution is a good fit for Poisson/lognormal? I suggest linking to some explanations of fallacies in the last paragraph because it isn't clear. – Oddthinking Nov 11 '20 at 04:29
  • 2
    You can't use percentages when applying Benford's law -- they don't span multiple orders of magnitude. If you use the raw vote count for Trump 2016, the distribution of leading digits looks decidedly Benfordian. – Mark Nov 12 '20 at 01:09
  • @Mark It's quite possible for percentages to span multiple orders of magnitude. Do you mean that these particular percentages don't span multiple orders of magnitude? That's my point: not all data sets follow Benford's Law. – Acccumulation Nov 12 '20 at 01:11
15

The reason that Benford's law often holds for real-life data is that real-life data is often fairly broadly distributed on a log scale.

[Benford's Law] tends to be most accurate when values are distributed across multiple orders of magnitude

https://en.wikipedia.org/wiki/Benford%27s_law

To get from a distribution on a log scale to a distribution of the sort that you usually see in illustrations of Benford's law, you do the following (covered in more detail here):

  1. "Wrap around" the buckets by ignoring the integer part of the base-10 logarithm, and using only the fractional part. If the distribution was broad, then the wrapped distribution will be fairly uniform over the range [0,1).

  2. Redistribute into nine buckets of unequal size, with the leftmost bucket ranging from log 1 = 0 to log 2 ≈ 0.30, the next bucket ranging from 0.30 to log 3 ≈ 0.48, and so on. If the distribution of fractional parts was uniform then about 30% of the data points will end up in the leftmost bucket, 18% in the next one, and so on.

Here's an example of how this works for data that does obey Benford's law: 2,069 randomly generated values (the same as the number of Chicago precincts) in a log-normal distribution with a standard deviation of 100.5:

The left graph is a histogram of the values on a log10 scale with a bucket size of 0.05. The middle graph is the same as the left, but combining buckets with the same fractional part. The right graph is the same as the middle, but with Benford-sized buckets.

Here are actual counts of votes for Biden in the 2,069 precincts, as found here:

You can see that the histogram on the left looks very much like the artificial data. The only difference is that the standard deviation is much smaller. As a result, the wrapped buckets aren't filled uniformly, and so the Benford-sized buckets aren't filled in proportion to their width.

Here's the corresponding data for Trump:

The distribution appears to be bimodal for some reason. Because of the dip in the middle, the wrapped buckets are somewhat less uniformly filled than they otherwise would be, but they are still more uniform than Biden's, simply because the distribution is broader. As a result, the Benford buckets are filled somewhat more in proportion to their width than Biden's were.

What can we conclude from this? I think the primary takeaway is that the middle and right graphs are absolutely useless. Every property of these distributions that might be of interest is present in the graphs on the left. The procedures that produce the other graphs only obfuscate the data. Is the nice Gaussian distribution of Biden's data evidence that it was made up like my artificial data? Is the dip in Trump's data evidence of some irregularity? Maybe (probably not), but whether it is or isn't can best be answered by looking at the original data. The first-digit plots are not helpful in the slightest. The deviation of Biden's data from Benford's law has nothing to do with the plausibility of it, and everything to do with the narrowness of it.

In contrast to the second-digit frequency plots, I don't see clear evidence that these first-digit plots were designed to mislead. But whoever made them is at least statistically illiterate; they don't understand why Benford's law is true to begin with, since if they did, they would have immediately (and correctly) guessed the reason why Biden's first-digit plot looks Gaussian.

Acccumulation
  • 2,873
  • 1
  • 14
  • 19
benrg
  • 3,134
  • 20
  • 19
  • 2
    Why should we believe you that Benford's law is inapplicable and not the claimant saying it is? Please [provide some references](http://meta.skeptics.stackexchange.com/q/5) to support your claims. – Oddthinking Nov 10 '20 at 11:50
  • 1
    This is a very good answer, unfortunately it is phrased in a way that might be too opaque for many readers (hence the request for references in the first comment). It could be summarized in a single simple sentence though: "Benford's law's goodness of fit here is closely related to the fact whether vote counts span multiple magnitudes (e.g. 1..1000 for Trump) or are more focused around a single magnitude order (e.g. 100..999, for Biden)". – KT. Nov 10 '20 at 15:41
  • 2
    @Oddthinking It's not clear to me what should be cited in an answer like this one where I just take the data from the question and bucket it in various ways, and point out that one distribution is narrower than another, etc. Do I need a source for something like the narrow standard deviation of Biden's vote totals (which would probably be impossible to find)? I added a link to a math stack exchange answer which has the same explanation of the connection between Benford's law and wide log-normal distributions. – benrg Nov 10 '20 at 16:27
  • 2
    @benrg: We don't allow Original Research here. We have no reason to trust that you have done a good job. Even if we can do the arithmetic ourselves and confirm it is correct, we can't be sure you've applied the right process - especially for a question where the applicability of the process is the real question. So, defending that all you've done is analyse the data is basically saying this is not an answer. – Oddthinking Nov 10 '20 at 17:50
  • 1
    @Oddthinking I disagree. This answer is quite self-contained. Do you have any specific problem with any of the claims made in the answer? Which of the claims require "trust"? – BKE Nov 10 '20 at 19:03
  • @BKE: This is an argument [we keep having on this site](https://skeptics.meta.stackexchange.com/search?q=logic). People thinking that their perfectly formed logic is correct and needs no justification. I remind you that the original claimant ALSO thought that. – Oddthinking Nov 11 '20 at 03:17
  • The whole argument here seems to be: This is what data looks like that classically follows Benford's Law. Here is what the data looks like for Biden. It doesn't follow Benfords's Law. Here is what the data looks like for Trump. It follow's Benford's Law better. Therefore Benford's Law is useless here. That last step could be replaced by "Therefore Biden' data is suspicious" with an equal level of justification given the data. – Oddthinking Nov 11 '20 at 03:23
  • 3
    @Oddthinking It doesn't seem like you're seeking justification for my claims; what you're seeking is someone else who makes the same claims as me, but who is more trustworthy. That's how sources work on Wikipedia. What I don't know is *how similar* their claim has to be to mine. If it's enough that they say that Benford's law doesn't work with narrow distributions, then I think my existing sources cover it. If they have to specifically talk about Chicago data, then I think the question is unanswerable at this time and all existing answers should strictly speaking be deleted. – benrg Nov 11 '20 at 03:31
  • 2
    @Oddthinking I also don't understand why you've singled out my answer. One of the other answers cites nothing, one cites only Wikipedia's article on Benford's law, and one cites only Wikipedia plus a random Redditor in r/donaldtrump who happens to agree with them, and those answers aren't flagged. – benrg Nov 11 '20 at 03:34
  • 1
    If you are saying I put absolutely no faith in the unreferenced analysis done by a random on the Internet: Yes! Exactly! Ideally, I want a peer-reviewed analysis, and failing that at least done by someone with an appropriate background and expertise that we can verify. You aren't being singled out. Answer on this question have attracted many flags. Many other bad answers have already been deleted. I suspect more will be. – Oddthinking Nov 11 '20 at 03:45
  • 1
    @Oddthinking A peer-reviewed analysis of what specifically? The Chicago data? Benford's law? Please give me some hint of what I need to add to save my answer from deletion. I get the impression that you have no knowledge of statistics and what you're seeking is essentially a tutorial on distributions and histograms and such that you can read to get a better idea of how to evaluate the claims; is that correct? – benrg Nov 11 '20 at 03:53
  • Let us [continue this discussion in chat](https://chat.stackexchange.com/rooms/116080/discussion-between-oddthinking-and-benrg). – Oddthinking Nov 11 '20 at 04:09
7

TL;DR: No they don't; Benford's Law doesn't apply like that to begin with and the analysis was done badly.

Over on twitter, Dr. Jen Golbeck finally lost her temper after one too many poorly sourced graphs and went on a brief but informative rant about it.

A tweet thread is hard to cite properly, and thankfully after she realized how much attention it was getting she transposed it to a somewhat more reliable medium. I'll quote some of the more relevant parts below.

First, a bit on the author: As per her bio, Jennifer Golbeck is is an associate professor at the University of Maryland in College Park and is Director of the Human-Computer Interaction Lab. More pertinent, possibly, is that when the Netflix documentary 'Connected' did an episode on Benford's Law, she's the one they consulted.

First, a basic primer on Benford's Law and how it's useful:

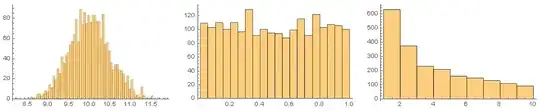
Benford’s law basically says that the first digit of numbers in some naturally occurring systems follows a pattern. You may intuitively think that numbers that start with 1 are just as common as numbers that start with 9, but in lots of systems, around 30% of numbers start with 1 and the frequency declines to where only like 5% of numbers start with 9. This is seen ALL OVER! I showed that it applied in social networks to friend counts and that it could be used to detect bots. It’s used in financial and accounting investigations and can even be used in court as evidence of fraud. The length of all the rivers on earth follow this pattern. Atomic weights. JPEG coefficients. It’s mindblowing!

If you want to know more about it, Netflix has a series out called Connected and episode 4 (Digits) is all about it. I’m in that documentary, so say hi when I come across your screen.

She then goes into explaining why it does not acually work on election results the way people think:

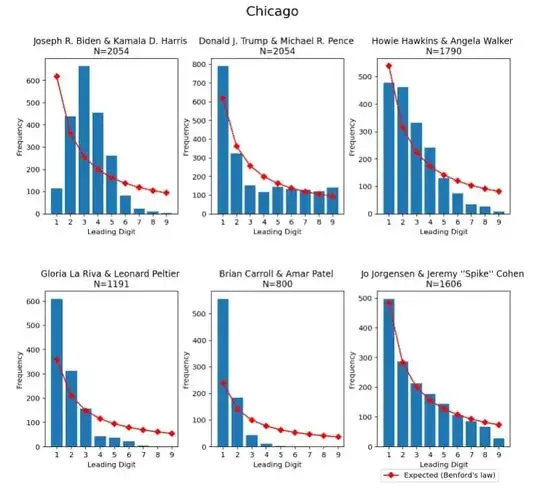
First, there’s not a big spread of orders of magnitude in precinct sizes. Most places Benford is applied, you have numbers in the 10s, the 100s, the 1,000s, the 10,000s, etc. Precincts don’t have that much variation in them because we don’t want them to be so giant that we can’t count all the votes. That’s one strike against Benford working.

Next, and this is really important, votes in a precinct are (basically) split between 2 candidates in this election. (3rd party candidates make up such a small percentage that they don’t matter for this point). If Trump gets X votes, Biden gets (basically) TOTAL- X.

Say every precinct has 1,000 people. If Trump follows Benford, Biden COULD NOT follow it.

This is not, in fact, an even remotely new development:

Third, we’ve studied this. We know it doesn’t work. People may share some data from past elections, but there are decades of research looking at elections around the world and it’s extremely well-established the first significant digit Benford analysis does not work here. Full stop.

In fact, she asserts that the people who claim it does are actively trying to mislead:

All the people who read a Wikipedia article and put some numbers in Excel are doing the thing I outlined above. We know this doesn’t work. They are lying — not just misinformed. Many of us have been tirelessly correcting their methods over the past 5 days, but they keep coming. They know it doesn’t work. The papers are all public and available. They do not care. It looks good for their argument and they are trying to trick you.

Like a good researcher, she goes on to cite her sources:

Here’s a quote from a paper on the topic:

“Benford’s Law is problematical at best as a forensic tool when applied to elections…Its ‘success rate’ either way is essentially equivalent to a toss of a coin, thereby rendering it problematical at best as a forensic tool and wholly misleading at worst.”

source: Deckert, Joseph, Mikhail Myagkov, Peter C. Ordeshook. “Benford’s Law and the detection of election fraud.” Political Analysis 19.3 (2011)

She cites a few more sources and reiterates the assertion that the people who claim Benford's law applies and proves election fraud are acting in bad faith, but I've already quoted entirely too much of the article verbatim as is.

I don't have the math background myself to check out her analysis, but it sounds persuasive.

Shadur
  • 3,355
  • 2
  • 26
  • 23
0

Professor Walter Mebane at the University of Michigan has written an (unpeer-reviewed) paper about this analysis, Inappropriate Applications of Benford’s Law Regularities to Some Data from the 2020 Presidential Election in the United States.

To date I’ve not heard of any substantial irregularities having occurred anywhere, and the particular datasets examined in this paper give essentially no evidence that election frauds occurred.

My interpretation: "Nice try, but no."

Mebane teaches Election Forensics at the University of Michigan, and has published a paper about Benford's Law and election fraud.

Mebane is arguably the premier authority on this topic. He is the one that applied it to the Iranian elections to prove fraud.

His work has been criticised in the literature, but Mebane has responded to this and everyone seems to miss it. He admits the utility of using Benford's law is an "open question."

Oddthinking
  • 140,378
  • 46
  • 548
  • 638
user57628
  • 11
  • 3
  • Have I understood this correctly? Most of the commenters, and far more importantly, most of the experts cited in answers, have said "Benford's Law is useless for detecting voting anomalies." You are citing an expert who is slightly maverick in that he says "Benford's Law is sometimes useful for detecting voting anomalies", but he also says "In the 2020 US Elections, there are no Benford's Law-based anomalies." – Oddthinking Nov 13 '20 at 04:54
  • The point is - even the guy who has used Benford's Law analysis to identify election fraud says that in this case, proper applications of BL analysis do not indicate any election fraud in 2020. This is very different from someone saying "Benford's Law cannot be used to identify fraud" in light of the fact that it has, actually been used to identify fraud in the past. – user57628 Nov 13 '20 at 19:15
  • Cool. So I have understood it. I was rather confused by the sudden twist in the last paragraph. – Oddthinking Nov 13 '20 at 19:23
-7

As was pointed out already, there are 2 clearly bogus and easily refutable charts (manipulated x-axis) that have been added to the bottom of the Benford charts on "Red Elephant" website. I've never heard of that site before, but think it's more constructive to refer to the original source of the Biden Benford's analysis.

The original research is here which shows that the counts do violate the Benford law for Biden in several large precincts and wards in Michigan and Pensylvannia- https://github.com/cjph8914/2020_benfords

and then reproduced here: https://www.youtube.com/watch?v=1VBK2BU0K6k

Benford’s law shows that 30% of the time, natural numbers will start with a 1. Only 18% of the time is it a 2 and so on down to a leading 9 which happens less than 5% of the time.

There is a key scene in the movie "The Accountant" when the fraud is finally discovered with this technique (due to the frequency of the number 3, in the second digit of the totals). This is an application of Benford's law. In an interview, an FBI agent said they use this technique all the time to sniff out fraud ( https://www.thewrap.com/accountant-adds-up-real-review-ben-affleck ) and this is the same analysis that people have been doing in the last couple days to investigate vote counts in the swing states.

“The Accountant” scene where Ben Affleck proves the fraud with Benford’s law: https://youtu.be/qdMo4ZnTyNs?t=66

  • 17
    This answer would be better if it didn't cite a fictional movie. And because Benford's Law is applicable to finding possible accounting fraud does not mean it's applicable to voter fraud. – Schwern Nov 09 '20 at 06:22
  • I cited the fictional movie because that's what the FBI agent was interviewed about in the link before it. FBI agent Cooper said about the technique: "Wolff also identified a series of suspicious transactions by the unusual frequency of the number 3 in their dollar values. Cooper said that was a use of Benford’s law, which lays out the predicted distribution of numbers in a naturally occurring set of data — and something accountants use all the time, through computer programs that analyze data, to sniff out possible problem spots. It identifies patterns that are against the normal. – user1139082 Nov 09 '20 at 11:32
  • 2
    If you consult the other answers - and indeed the references to Benford's Law in the question - you will see that, even if it is applicable to some (limited) areas of accountancy, Benford's Law is not expected to be strongly applicable to electoral votes, due to the lack of broadly varying scale. Your answer side-steps this fatal flaw in the analysis. – Oddthinking Nov 11 '20 at 04:23