The recommendations come from this report to the Chief Medical Officer:
The headline recommendation was chosen to be
the level of drinking where alcohol would be expected to cause an overall 1% lifetime risk of death
That is, a 1% lifetime risk of dying of an alcohol-related condition, including accident and injury due to drinking, as well as alcohol-related medical conditions like liver failure and oesophageal cancer.
The reason for giving a single headline recommendation ("you are safest not to drink regularly more than 14 units of alcohol per week") that does not take into account sex, body mass, age, and other variables, is in order to keep it
simple, specific, measurable, timebound, and realistic
If you're happier to accept a higher lifetime risk than 1%, or if you think the differences between men and women might be significant, then you can look at the CMO's report to get the extra detail. Or you could just ignore the guidelines and carry on drinking as you were—it's just a guideline, not the law.
The criticism made by the Register is based on a confusion between two uses of the word "safe". When the Chief Medical Officer says that there is no "safe" level of alcohol consumption, she means that there is no level of drinking at which the risk of dying from an alcohol-related condition goes to zero. Whereas the Register is using "safe" to mean the level at which the harm due to drinking is balanced by the benefits. Note that the protective effect of moderate consumption of alcohol is discussed in detail in the CMO's report (see pages 14–19).
So where did the lifetime risk levels in the CMO's report come from? They are from this report commissioned from the Sheffield Alcohol Research Group:
The numbers are the output of a computer model, the Sheffield Alcohol Policy Model (SAPM):
The key data inputs into SAPM are baseline levels of current UK alcohol consumption, current levels of alcohol-related mortality and morbidity (defined as person-specific hospital admissions) and, most importantly, international and UK-specific evidence relating different levels and patterns of alcohol consumption to risk of mortality or morbidity from 43 health conditions causally related to alcohol consumption. This evidence is taken from a combination of published meta-analyses of risk relationships, analyses of the proportion of cases of alcohol-related conditions attributable to alcohol and UK mortality and morbidity rates for the 43 conditions.
The model and its inputs are described in detail in section 3 of the Sheffield report. Take a look and see if the approach makes sense to you.
Update
A comment points to this article by Adam Jacobs ("The Stats Guy") as a criticism. Unfortunately, Jacobs misunderstood the figures in the Sheffield report, and so much of his criticism is nonsensical.
Consider figure 11 from the Sheffield report.
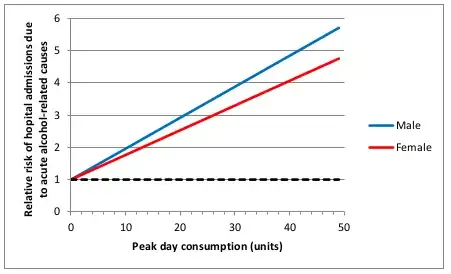
This graph plots lifetime risk of hospitalization due to an alcohol-related cause, relative to someone who does not drink, against peak day alcohol consumption. Hence the relative risk is 1.0 when peak consumption is 0.
But Jacobs describes this as "how many times more likely you are to be admitted to hospital for an alcohol-related cause than you are on a day when you drink no alcohol at all".
I think the confusion here must be over "alcohol-related cause". The Sheffield group uses this to mean "a condition that can be caused by alcohol"—the point being that you can still be hospitalized for liver cirrhosis even if you have never drunk alcohol (liver cirrhosis has multiple causes). Whereas Jacobs seems to understand this as "a condition definitely known to have been caused by alcohol" and then struggles to find an interpretation of the graph that would make this work (because non-drinkers can't be hospitalized for such a condition, and so there would be no base rate to derive a relative risk from). The Sheffield report could have done a better job of explaining this.