4

I heard people say that assuming tomorrow's weather will be the same as today's is as good as, or better, than meteorological models.

  • This book says people assume is the best way

  • This site claims that it's 40% accurate.

Has anyone tested the accuracy of this model and compared it to modern weather predictions?

Sklivvz
  • 78,578
  • 29
  • 321
  • 428
I. Haage
  • 49
  • 1
  • 3
  • How accurate it can be would be interesting to see, but both me and likely a lot of other people have seen weather shift rather fast. I've had one point where it rained and was cold the first day, sunny and summer warm the other... – Sharain Mar 29 '15 at 13:00
  • 3
    @Sharain: Yes, anecdotal data like that is not terribly helpful when the claim is that it is (only) 40% accurate. – Oddthinking Mar 29 '15 at 13:27
  • @Oddthinking the claim is also that it is (or was) more accurate than weather models. – Sklivvz Mar 29 '15 at 14:19
  • @Sklivvz: Yes, agreed. Just pointing out that saying "This weather prediction was really wrong once" isn't evidence we can use. All weather predictions are really wrong sometimes. – Oddthinking Mar 29 '15 at 14:54
  • 4
    Accuracy in % is not necessarily the most useful metric in weather forecasting. A meteorologist in Saudi Arabia might correctly predict the weather with this model 364 days per year. What makes him (or her? not sure in SA) valuable is predicting the one day that the storm strikes. It also depends on the precision of the forecast. Also, the accuracy of a "tomorrow equals today" model is going to vary tremendously on location. – gerrit Mar 31 '15 at 15:22
  • 1
    @gerrit: It's also helpful to understand just why this seems to be a good model, when in fact it isn't really useful. In many places, the weather comes in systems that take several days to pass any given location. For instance, here in the western US, a ridge of high pressure can settle in for many days, bringing clear skies & warm temperatures; or Pacific storm systems may take days to pass through. Thus there will be many more 'similar' days within a system than days which transition between them. (See any meteorology text for references.) – jamesqf Apr 02 '15 at 21:33
  • There is a whole field of research into the statistics of time series of atmospheric data. For example, see: Wilks, Daniel S. *Statistical methods in the atmospheric sciences.* Vol. 100. Academic press, 2011. Chapter 8 deals with time series and contains a wealth of relevant information. – gerrit Apr 02 '15 at 21:49
  • If you want a fantastic dataset to look at, I'd suggest the [WxChallenge forecasting competition](http://www.wxchallenge.com/challenge/results.php). You can go through results from over a decade of forecasts by hundreds of from university students (typically majoring in meteorology), professors, and alumni, and compare them to how the NWS, models, persistence and climatology fared when forecasting the night before for varying cities. Generally persistence has better success in places/seasons with less variability (Mediterranean/tropical climates, and summer), but isn't too reliable. – JeopardyTempest Aug 06 '18 at 06:32

2 Answers2

10

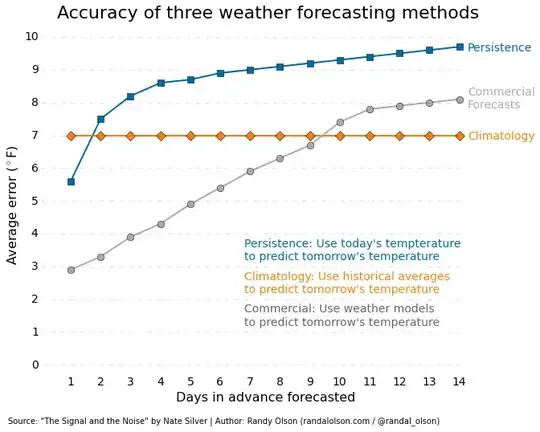
Blogger Randal Olson reproduced a chart from Nate Silver's The Signal and the Noise which in turn has based on data from ForecastWatch.

enter image description here

Ignore the orange line; it is irrelevant for this discussion. (Just for illustration: It is based on a similar idea of predicting that it will be hot on your birthday, because it has been hot on your previous birthdays.)

The blue line represents Persistence - the concept in the question.

The grey line represents commercial quality forecasts.

The higher the line, the worst the estimate.

The blue line is always higher than the grey line - a delta of about 2.5 °F (about 1.5 °C) after 1 day.

Based on this, we can conclude that, although Persistence isn't a terrible model (predicts with an error of only about 5.5 °F, or 3 °C), it performs much more poorly than a professional weather estimate on temperature forecasts.

Oddthinking
  • 140,378
  • 46
  • 548
  • 638
  • 1
    Are forecasts by organisations like NOAA "commercial forecasts"? – gerrit Apr 02 '15 at 15:03
  • Also, note that this considers only temperature. For most people, precipitation and wind are very much part of weather, and the quality of the "persistence" model might be even worse there. – gerrit Apr 02 '15 at 15:07
  • @gerrit Do non-sailors care much about the wind? Assuming the temperature is 'seasonable' I would mostly only want to know whether it's going to rain: and the "persistence" model might be quite good there -- "no rain today and no rain tomorrow" or "rainy today and rainy tomorrow". – ChrisW Apr 02 '15 at 15:18
  • 2
    @ChrisW In The Netherlands, almost everybody cares about the wind, because if it's windy you might have to leave home 10 minutes earlier for getting to work on time (by bicycle). So it depends on the area. – gerrit Apr 02 '15 at 16:18
  • @gerrit Thank you, I'd forgotten that there's a country where cyclists aren't a negligible minority. – ChrisW Apr 02 '15 at 16:24
  • I have to hasten to point out that the way this graph is laid out is incredibly misleading. At a casual glance, it looks like Persistence comes out on *top*, unless you read the axis and understand what they mean. It's not misleading data, but the way it's presented creates a bad first-impression. – Zibbobz Apr 02 '15 at 16:46
  • 1
    Misleading unless you read the axis? Huh? What are we, illiterates? Would you say a graph comparing prices is also misleading if the cheapest alternative is the line furthest down? – gerrit Apr 02 '15 at 17:19
  • @gerrit If the axis is labeled poorly? Yes. I'm not saying we should be expected to read a graph perfectly without reading the axis, I'm saying it *might* be why a misconception like this starts in the first place. – Zibbobz Apr 02 '15 at 18:44
  • @Zibbobz The fact that it goes up as a function of time should make it obvious that higher is worse, even without reading any labels. – gerrit Apr 02 '15 at 18:48
  • You are both right. Graphs, including this one, can have misleading axes, which obscure their real meaning at first glance. As a result, yes, it is important to read the axes markings carefully. It is easy to understand why it is oriented this way - it measures error, which has a lower bound of zero, and no upper bound. However, I did note when first looking at the graph, it was unintuitive, and so I explicitly emphasized that the higher the line, the worse the estimate. I hoped that was enough to avoid confusion. – Oddthinking Apr 03 '15 at 00:33
  • Yes, chance of rain, number of millimetres of rain, humidity, wind speed and wind direction, *minimum* temperature, barometric pressure, tides and swells, sunrise and sunset times, wind chill factors, fire danger, pollen counts, UV Index, and Groundhog shadows are all part of meteorological predictions. The question was vague about what was included. I think maximum daily temperature was implied, as it is generally the most important factor people think of as a weather prediction. – Oddthinking Apr 03 '15 at 00:38
  • Another shortcoming to consider: Regional differences. I've lived in difference cities, which have had different predictabilities. (I claim, anecdotally, the climatology and persistence model would work worse in temperate Melbourne, with notoriously changeable weather, than in tropical Darwin where it never rains for certain months, and then has tropical storms virtually every night for other months.) – Oddthinking Apr 03 '15 at 00:42
  • The image seems to be broken. – Andrew Grimm Jul 12 '17 at 10:46
0

It is not possible to answer this question as asked because:

  1. What do you mean by weather? Rainfall? Temperature? Wind?
  2. Where in the world are you talking about - different places have more or less climatic variation.

However, just for fun, I downloaded the rainfall data for the Canterbury Racecourse Automatic Weather Station from the Australian Beureau of Meterology (here) and analysed just the rainfall data.

There were 248 days where the previous days rainfall (yes/no) was the same as the current day and 101 that were different, an accuracy of about 71%.

This only adds up to 349 not 364 because:

  1. January 1st has no comparison day in the data set
  2. There were 8 days when no measurements were taken - because these were scattered this led to 14 days where no comparison could be made.

You can do this for any place where such data is available.

Dale M
  • 1,325
  • 9
  • 12
  • Please read the notice above and fix your answer accordingly. 1. You need to show your calculations have general validity; 2. You are not comparing the value you found to the predictions, anyways; 3. Avoid any "this is not possible to answer" comments in an ...answer. If it's not possible to answer, suggest a fix in a comment, not an answer; if it's possible to answer, then answer, but don't comment :-) – Sklivvz Apr 02 '15 at 09:38
  • There is actually a lot of research into this topic already, check Markov Chains and autoregressive models. – gerrit Apr 02 '15 at 21:39