I was reading Superfreakanomics and the book argues that we had a global cooling period 40 years ago? Is that claim accurate?
Asked
Active
Viewed 2,068 times
27
Larian LeQuella
- 44,977
- 18
- 187
- 208
Vinoth Kumar C M
- 2,975
- 6
- 26
- 31
-
9Are you talking about a period in which cooling occurred, or in which scientists claimed concern about global cooling? – Andrew Grimm May 07 '11 at 09:35
3 Answers
43
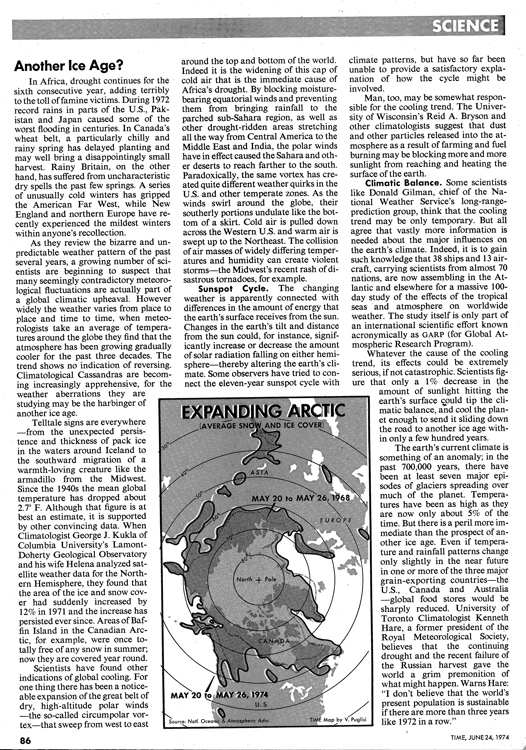
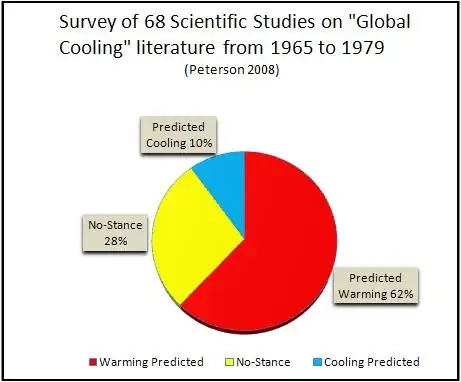
That "myth" was started by Newsweek and irresponsible journalism more than any peer reviewed publications. Time was equally responsible. However, if you look at the number of actual papers published on the subjects of climate change, you will see that most were actually more concerned about warming:
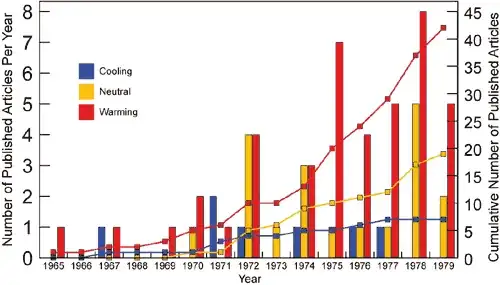
Or viewed another way:
Keep in mind that climate change and global modeling was very new. Computers of the time were not equipped to handle this sort of calculation. Even so the 1975 US National Academy of Sciences/National Research Council Report, the most comprehensive study on climate change, and closest to scientific consensus, issued a report. Their basic conclusion was "…we do not have a good quantitative understanding of our climate machine and what determines its course. Without the fundamental understanding, it does not seem possible to predict climate…"
This is in strong contrast with the current position of the US National Academy of Sciences: "...there is now strong evidence that significant global warming is occurring... It is likely that most of the warming in recent decades can be attributed to human activities... The scientific understanding of climate change is now sufficiently clear to justify nations taking prompt action."
Now looking at the image Fabian has given us, it only shows a little over 100 years, and one may not appreciate the severity of temperature changes. While there are small dips and some areas with a downward trend, this does in no way cover geologic time.
Compare this to temperature changes as derived from numerous sources for the past 1000 years:
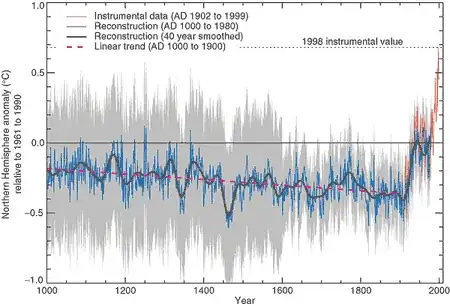
Most of these arguments come from the "Hockey Stick is broken" arguments. Most of these come from the science not having all the tools available or developed at the initial time. However, since these initial measurements were made, more and more tools have become available. And they are agreeing with the initial set of measurements.
Again, with all this, you will notice statistical fluctuations. The best way to describe these would almost be to say they are weather. Weather is not climate. As shortlived humans, we have a difficult time remembering or projecting more than a few months in advance of our present time on a personal basis. Hence why weather changes seem so prevalent to us, even though they may only span a series of a few years. The overall trend is still very much upward.
Larian LeQuella
- 44,977
- 18
- 187
- 208
-
1The past 1000 years (1000-2000) seems strange to me. I though it is a well established fact there was a [Medieval Warm Period](http://en.wikipedia.org/wiki/Medieval_Warm_Period) "1 °C warmer than today 1000 years ago" - this is not seen on the graph in this answer. – Suma Jun 21 '11 at 08:24
-
3@Suma, Notice the grey region above and below the line. That is the uncertainty in the data. And I don't think it's well established fact that that period was 1C warmer than today, but rather 1C warmer than the historical average to that point. Huge distinction. [link=http://en.wikipedia.org/wiki/File:2000_Year_Temperature_Comparison.png]This graph shows that.[/link] – Larian LeQuella Jun 21 '11 at 15:22
-
3From the paper you quote: "By the early 1970s, when Mitchell updated his work (Mitchell 1972), the notion of a global cooling trend was widely accepted" – vartec Jul 05 '11 at 15:52
-
3@vartec, the graphs in this answer show a short cooling period between 1940 and 1950. If you look at the Northern Hemisphere rather than the whole globe, it's more like 1940-1970. So, yes, there is scientific consensus for a short cooling period during that time. You can [read more about this here](http://www.aip.org/history/climate/20ctrend.htm). This is not the supposed "new ice age" predictions repeated in the popular press, though. It's a (mostly) accurate description of what *did* happen rather than a prediction about what *might* happen. – Craig Stuntz Jul 07 '11 at 15:02
-
1@Craig: another quote *"Global cooling and related rapid changes of environment, substantially exceeding the fluctuations experienced by man in historical times, must be expected within the next few millennia or even centuries. In man's quest to utilise global resources, and to produce an adequate supply of food, global climate change constitutes a first order environmental hazard which must be thoroughly understood well in advance of the first global indications of deteriorating climate. "* http://goo.gl/rhtzm – vartec Jul 07 '11 at 15:14
-
1@vartec, I find it very easy to believe that a voice vote of scientists in the seventies would have agreed that cooling would happen "...within the next few millennia or even centuries..." but again, I don't think that's what people mean when they describe either the supposed new ice age scare or the post-1940s cooling. A lot can happen in a few million years. – Craig Stuntz Jul 07 '11 at 15:22
-
1@suma the ~1C warming during the midieval warm period was in the N Atlantic; other regions cooled during that time so hemispheric and global means were not as variable as regional anomalies. See IPCC or [wikipedia](http://en.m.wikipedia.org/wiki/Medieval_Warm_Period). – David LeBauer Jul 09 '11 at 03:31
-
1
-
1Another pie chart: http://www.slate.com/blogs/bad_astronomy/2012/12/11/climate_change_denial_why_don_t_they_publish_scientific_papers.html ;) – JasonR Dec 11 '12 at 13:33
21
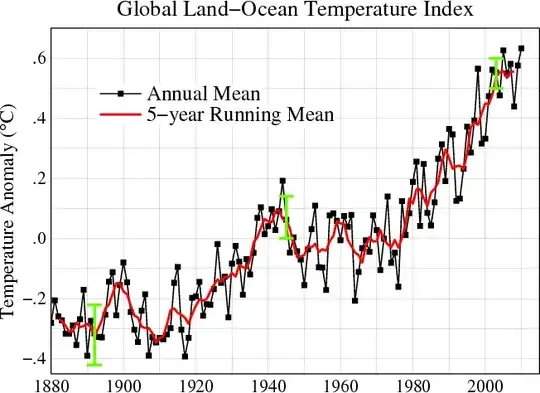
The following graph shows the temperature data from the Goddard Institute for Space Studies (GISS):

You can see some years where the global mean temperature anomaly went down for a decade or two, mainly around 1900, 1940 and 1960. This does not really change the overall trend you see in the picture.
Larian LeQuella
- 44,977
- 18
- 187
- 208
Mad Scientist
- 43,643
- 20
- 173
- 192
-
1To be precise: That's the mean of the temperature *anomaly*, as the axis label says, not "the global mean temperature." I'm nit-picking, but a lot of people get this mixed up. – Craig Stuntz Jun 14 '11 at 12:32
12
Although there is no evidence for cooling, there is evidence that the rate of warming slowed down during this time period.
Human activity emits both greenhouse gases and aerosols (solid particles that float). Whereas greenhouse gases have a warming effect, aerosols can have a cooling effect.
The cooling effect of aerosols can be caused both by direct interception of sunlight by the particles and by the increase in cloud cover caused by the fact that aerosols serve as cloud condensation nuclei. See figure below.
Around 1970, it was not clear if the cooling effect of aerosols or the warming effect of CO2 would have a greater effect on global climate (Rasool and Schneider, 1971)
Over the past few decades, in part due to the clean air act, the ratio of aerosols to CO2 has declined due to the use of cleaner burning fuels, more efficient combustion, and the removal of both gaseous and particulate pollutants from exhaust. Furthermore, aerosols, SOx, and NOx do not remain in the atmosphere as long as CO2. During this time, the warming effect of CO2 has overwhelmed the cooling effect of aerosols.
Still, there is no evidence that the mean global temperature was decreasing from the 1940's to the 1970's, only that the rate of warming was stalled.
All info, and figure below from IPCC Climate Change 2007: Working Group I: The Physical Science Basis, in particular chapter 9
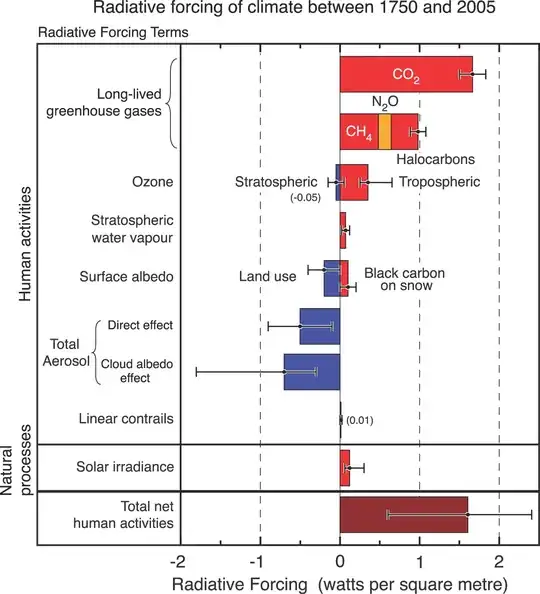
Rasool, S.I. and S.H. Schneider, 1971. Atmospheric Carbon Dioxide and Aerosols: Effects of Large Increases on Global Climate. Science 173 (3992): 138.
David LeBauer
- 1,445
- 15
- 20