24

While watching this video, it makes the claim at about the 12 minute mark that US crime rates are lower across the board.

It then shows a graph that lists various violent crimes with numbers in columns for 1992 and 2011.

It lists:

US Crime Rates:            1992 vs. 2011
  Violent Crime:          757.7 vs. 386.3
  Murder Rate:              9.3 vs. 4.7
  Rape Rate:               42.8 vs. 26.8
  Robbery:                263.7 vs. 113.7
  Aggravated Assault:     441.9 vs. 241.1
  Property Crime:        4903.7 vs. 2809.7
  Burglary:              1168.4 vs. 702.2
  Larceny/Theft:         3103.6 vs. 1976.9
  Motor Vehicle Theft:    631.6 vs. 229.6

Crime Rates Chart

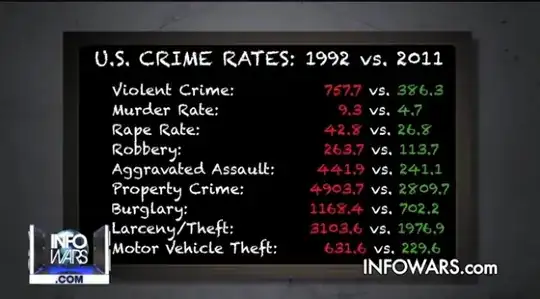
Personally, I'm a little annoyed that the chart doesn't show units (like incidents per thousand persons) and also fails to show a source. To make things worse, it does not define some of the more ambiguous "crimes" such as "violent crime" and "property crime."

I have heard elsewhere that many crimes were at all-time highs in the early and mid 1990's, but I am more concerned with these exact numbers. How close are they to reality? I understand that the answer will have to take some liberties on what the numbers actually mean (units) and might just have to do some (gulp) math. Sorry about that. I didn't make the claim; I'm just skeptical about it.

I think the easiest way to verify these numbers with reality would be ratios. For example, "Violent crime" is down 51% (386.6/757.7), according to the chart. Does this match with a respectable source?

  • 3
    Their use of a non-fixed-width-font is frustrating too as it makes it difficult to compare the numbers. – Mark Henderson Jun 11 '14 at 04:41
  • 7
    I would be more worried about cherry picking 1992 and 2011. If I type "[violent crime rate history](http://www.wolframalpha.com/input/?i=violent+crime+rate+history)" into wolframalpha, I see a huge peak around 1992. Compare these numbers between 1980 and 1992 and it looks a lot less dramatic. Also, at least murder rate has been going down on a global scale, not just the US, might be pinned to forensic science. – Dorus Jun 11 '14 at 10:03
  • 1
    @Dorus I suppose the impression might be cherry picking, assuming that there are persons that don't know the early 1990's were all-time highs, however, a nearly 2 decade decline of crime in general is significant on its own standing, in my opinion, and is something that has been studied at length and no single thing that take credit for it. Personally, I think technology is mostly responsible. The internet was publicized and commercialized, and cable and satellite television became affordable, leading to entertainment highs, or, in other words, it kept people busy. Idle hands, the devil's work –  Jun 11 '14 at 16:01
  • 1
    ageing population – Nick Maroulis Jun 11 '14 at 23:44
  • 2
    @Dorus Well, it is not really a peak in a sense of spike. The rate was trending up steadily. IMO, this is not cherry picking - there is a clear reversal at that point and this statistics does represent the overall current trend. – sashkello Jun 12 '14 at 00:22

1 Answers1

46

These numbers look legitimate. They are given per 100,000 (which is a standard practice, and often assumed by default). Both 1992 and 2011 numbers exactly match FBI report (and apparently were taken from there), and I don't see any reason to doubt them. Here is a summary for 1992 & 2011 from the report:

Table 1—Crime in the United States, by Volume and Rate per 100,000 Inhabitants, 1992–2011

Year                                                 1992         2011
Population....................................255,029,699  311,591,917
Violent crime...................................1,932,274    1,203,564
Violent crime rate..................................757.7        386.3
Murder and nonnegligent manslaughter...............23,760       14,612
Murder and nonnegligent manslaughter rate.............9.3          4.7
Forcible rape.....................................109,062       83,425
Forcible rape rate...................................42.8         26.8
Robbery...........................................672,478      354,396
Robbery rate........................................263.7        113.7
Aggravated assault..............................1,126,974      751,131
Aggravated assault rate.............................441.9        241.1
Property crime.................................12,505,917    9,063,173
Property crime rate...............................4,903.7      2,908.7
Burglary........................................2,979,884    2,188,005
Burglary rate.....................................1,168.4        702.2
Larceny-theft...................................7,915,199    6,159,795
Larceny-theft rate................................3,103.6      1,976.9
Motor vehicle theft.............................1,610,834      715,373
Motor vehicle theft rate............................631.6        229.6

Populations are U.S. Census Bureau provisional estimates as of July 1 for each year

All the terms used in the claim are not speculative, they are used in legal sense and have strict definitions, which you can find on FBI site as well (i.e., here).

sashkello
  • 3,762
  • 3
  • 28
  • 37
  • Wow! Excellent! I really did not expect them to match an official report exactly. –  Jun 11 '14 at 06:02
  • To prevent link rot, could you add a little more information from the links to this answer? – gerrit Jun 11 '14 at 15:29
  • @gerrit probably not necessary. .gov sites keep content pretty much forever. –  Jun 11 '14 at 15:56
  • @fredsbend Really? Several times in the past weeks, the Atlas of Canada gave me a message *To better serve Canadians, the Atlas of Canada recently re-organized its website and archived older content.*. That includes links from their own internal search engine. I am not convinced that the US government is much more capable in preventing link rot. – gerrit Jun 11 '14 at 16:01
  • 3
    @gerrit well, go ahead and edit it then. You don't have to wait for sashkello to do something like that. –  Jun 11 '14 at 16:03
  • Is there any indication of why it peaked so high in 92? Or is that a question for another site – Cruncher Jun 11 '14 at 18:02
  • @Cruncher A lot of factors are likely responsible. There are dozens, maybe hundreds, of studies looking for answers. Plenty to look at in a [Google Search.](https://www.google.com/webhp?sourceid=chrome-instant&ion=1&espv=2&ie=UTF-8#q=why%20was%20crime%20so%20high%20in%20the%2090s) This site is like a mythbusters/debunking site. If you see a claim somewhere that you are not sure is true, you post a question here and we find out. –  Jun 11 '14 at 22:48
  • 2
    Freakonomics says the drop in crime rate is predominantly because of Roe vs Wade. But that's a whole new question for Skeptics. – James McLeod Jun 12 '14 at 00:54
  • In addition to myriad confounding factors in analysing this change, note that crime statistics are almost always *reported crime* only, which depends on 2 things: people reporting crimes, and police officers recording them accurately. In the UK, to police have got into a lot of trouble about their figures: http://www.theguardian.com/uk-news/2014/jan/15/police-crime-figures-status-claims-fiddling – James Jun 12 '14 at 12:29