tl;dr — Fonts can influence the perceptions of the reader. Whether they can substantially raise your grades is an open question and no scientifically rigorous study seems to have been performed on the point. An anecdotal study on the point suggests that Georgia and Times New Roman will result in higher grades than Trebuchet MS. A more sophisticated study suggests that words set in Baskerville are more agreeable than words set in other typefaces.
You can read more about both studies in the NY Times article Hear, All Ye People; Hearken, O Earth by Errol Morris, which summarizes the anecdotal study on grades: "The Secret Lives of Fonts" by Phil Renaud:
Renaud had written 52 essays in total. Eleven were set in Times New Roman, 18 in Trebuchet MS, and the remaining 23 in Georgia. The Times New Roman papers earned an average grade of A-, but the Trebuchet papers could only muster a B-. And the Georgia essays? A solid A.
Errol goes on to note of the original article:
But Renaud’s results are anecdotal. I wondered: is there an experiment that could decide this once and for all? Or barring that, at least throw some empirical light on the situation? Could the effect of typography on the perception of truth be assessed objectively?
Here is how he performed a more trustworthy experiment:
Benjamin Berman (who designed the Multics emulation for my Times article “Did My Brother Invent Email with Tom Van Vleck?”) created a program that changes the typeface of the David Deutsch passage. Each Times participant read the passage in one of six randomly assigned typefaces — Baskerville, Computer Modern, Georgia, Helvetica, Comic Sans and Trebuchet. The questions, ostensibly about optimism or pessimism, provided data about the influence of typefaces on our beliefs.
The test consisted of comparing the responses and determining whether typeface choice influenced our perception of the truth of the passage.
More than 100,000 people clicked on the page, and approximately 45,000 people took the quiz.
The conclusions of the study being (my emphasis):
Baskerville is different from the rest. I’d call it a 1.5% advantage, in that that’s how much higher agreement is with it relative to the average of the other fonts. That advantage may seem small, but if that was a bump up in sales figures, many online companies would kill for it. The fact that font matters at all is a wonderment.
Here is a quote about the statistical significance of the Baskerville effect, from the article:
For those interested in the statistical analysis of the data, I have included a note from David Dunning. I had wondered whether the “Baskerville Effect” was so small as to be insignificant. A 1.5 percent advantage. Dunning assured me otherwise. He wrote to me, “In the 1990s, the federal government stopped a big trial testing whether taking aspirin prevented heart attacks. The aspirin worked, and it was considered unethical to prevent the control group from starting to take the drug. Size of the advantage to aspirin? It was 0.8%.”
David Dunning goes on to say, and I will quote at length from Part 2 of Errol Morris's article:
I have done three analyses, to see if they converge on the same conclusion. Two of them do; the third does not but involves a cruder and less sensitive measure, and so I am not too disappointed.
Scenario #1: The first analysis is to take the coding scheme you used to weight confidence (+3, +2, +1, -1, -2, -3) and ask this question. I redid the “omnibus” ANOVA that Ben carried out and got practically the same result, F (5, 45518) = 2.90, p = .013, any slight difference from Ben’s numbers are probably due to rounding error. What this result suggests is that the averages of the six font groups differ more from one another than one would expect by chance. Something somewhere is going on.
To get more specific, I next looked at each font in turn, to ask whether it produces responses that differ from the average of the other 5? When I do that analysis, these are the results I get:
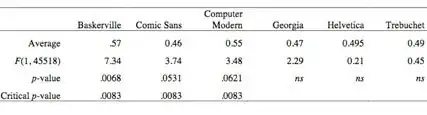
Now, here are two catches. We never completely rule out random chance as a possible cause of any result we see. But, sometimes the result is so strong that chance is just very, very unlikely. What’s strong enough? If the p-value is .05 or less, we typically dismiss chance as an explanation, by “industry agreement”. That is, we tolerate a 5% chance on any one comparison that what we are looking at is merely random variation.
But here’s the second catch. I am doing 6 tests here, not 1 — and so there are 6, not 1, opportunities for me to be just looking at random chance. So I have to be more conservative in any call to dismiss chance as an issue. There are many ways to do this. For now, let me be just simple, blunt, and very conservative. I’m doing 6 tests and I want to give myself no more than a 5% chance of making an error, then let me simply divide .05 by the number of tests I’m doing. That means that the p-value needed for me to dismiss chance falls to .0083 (Or .83%). By this, Baskerville is still different from the average of the others.
If people prefer to ask instead to about differences between individual groups, I can confidently say people are responding to Baskerville more favorably than they are to Comic Sans (Tukey’s honest significant difference, q = 4.24). Given so many other group to group comparisons, it be-comes difficult to rule out chance for any other individual comparison.
Scenario #2: The coding scheme you used is reasonable, but it does have an unusual feature and there are alternatives. Specifically, there’s a gap right in the middle of your scheme between ‐1 and +1, and some might question whether having that gap is reasonable. That is, is moving from ‐1 (slightly disagree) to +1 (slightly agree) really twice as different as moving from +1 (slightly agree) to +2 (moderately agree)?
Interesting question, so I redid the analysis with a different coding scheme that removes this gap problem by stacking the responses up and placing the same interval in between them: -5(strongly disagree), -3(mod disagree), -1(slight disagree), +1(slight agree), +3(mod agree), +5(strong agree).
This is normally the way I would “weight” the confidence scores in my own research, so I’m comfortable with it.
The omnibus ANOVA calculation is significant, F(5, 45518) = 2.88, p = .013. Something’s going on.
Then I redid the analysis from comparing each font against the average of the others.
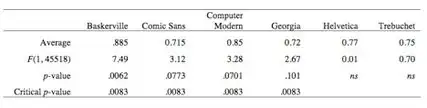
And, as you can see, this re-weighting scheme changes little. People are responding to Baskerville differently than they are the average of the other tests, even after correcting for the fact that I’m doing multiple tests. Any results for Comic Sans and Computer Modern weaken a touch; maybe, if generous, one could say that Georgia is “marginal,” but before correcting for chance. For individual group-to-group comparisons, the only one outstripping chance is the Baskerville to Comic Sans comparison (Tukey HSD q = 4.11).
Now, you may ask which of these coding schemes is the superior one. My answer is I don’t care. They are both reasonable. What is important is that they both lead roughly to the same conclusion.
Let’s just look at the data the most crude way possible, just counting up the percentage of times people agreed with Deutsch’s statement:
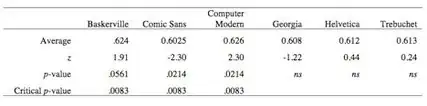
I switch from an Ftest to a ztest because the data are binary (i.e., agree, disagree) rather than more smoothly continuous. Here, no differences in fonts survive the chance correction put in place.
Essentially, what this is telling me is that throwing away the fine-grained information contained in the confidence ratings obscures the precision of the test.
But this analysis gives us a way to quantify the advantage to Baskerville. It’s small, but it’s about a 1% to 2% difference — 1.5% to be exact, which may seem small but to me is rather large. You are collecting these data in an uncontrolled environment (who knows, for example just how each person’s computer is rendering each font, how large the font is, is it on an iPad or iPhone, laptop or desktop), are their kids breaking furniture in the background, etc. So to see any difference is impressive. Many online marketers would kill for a 2% advantage either in more clicks or more clicks leading to sales.
On the exact claim in question here, there is the study from the original article ("The Secret Lives of Fonts") that indicates that Times New Roman correlates with an A-, and Georgia with an A, significantly higher than the B- average with Trebuchet. However as Errol noted, it was an anecdotal study. That said, there is a correlation between fonts and the perception of the reader.
So the claim that Times New Roman (or Georgia) will lead to higher marks than Trebuchet (or other sans-serif fonts like Arial or Helvetica) seems plausible. It is plausible, in other words, based on the specific results of Phil Renaud's anecdotal study and based on the conceptual results of Errol Morris's study, that simply changing your font from a sans-serif to a serif (particularly Baskerville, but also potentially Georgia and Times New Roman) will lead to higher marks.
As an aside, I have written at some length about this as well.
Further reading