TL:DR - The graph isn't comparing the same measurements of unemployment, disregards the preference of one of its sources, and as far as I can tell peak unemployment during the Great Depression was roughly double what it was during the "Great Recession".
Let me start off with other sources before I delve into the specific works cited in your graphic. As-is, the Bureau of Labor Statistics defines Unemployment six different ways (U1-U6):
U1: Percentage of labor force unemployed 15 weeks or longer.
U2: Percentage of labor force who lost jobs or completed temporary work.
U3: Official unemployment rate per the ILO definition occurs when people are without jobs and they have actively looked for work within the past four weeks.
U4: U3 + "discouraged workers", or those who have stopped looking for work because current economic conditions make them believe that no work is available for them.
U5: U4 + other "marginally attached workers", or "loosely attached workers", or those who "would like" and are able to work, but have not looked for work recently.
U6: U5 + Part-time workers who want to work full-time, but cannot due to economic reasons (underemployment).
Note: "Marginally attached workers" are added to the total labour force for unemployment rate calculation for U4, U5, and U6. The BLS revised the CPS in 1994 and among the changes the measure representing the official unemployment rate was renamed U3 instead of U5.
As Wikipedia states, the U3 measure is the "Official" measure, but U6 is oft-cited as the "true" unemployment rate by critics.
Estimates for the U3 rates since 1890 have been compiled, with the 1930-1940 data calculated by Robert M. Coen (1973) and afterwards by the BLS:
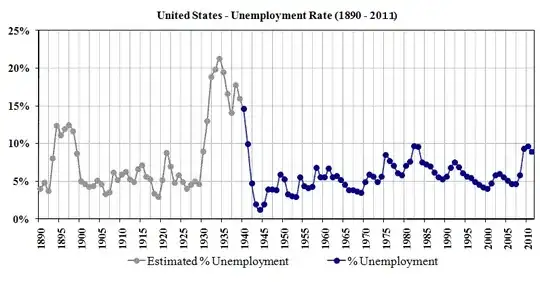
As you can tell from the graph, the U3 rates for the Great Depression mimic the information in the graphic: Roughly 23%. However, the U3 rates for 2010 is less than half of the Great Depression's peak: Roughly 10%.
Wikipedia also has a graph comparing the various UX rates since the 1950's.
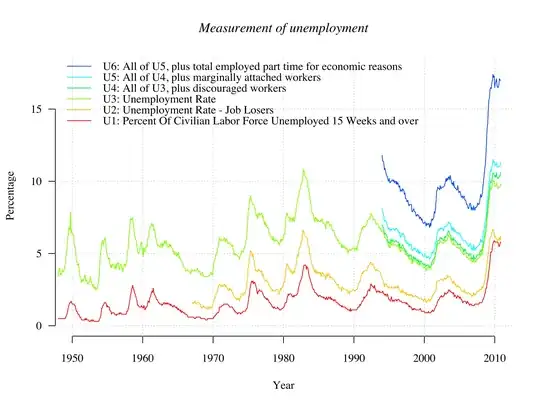
The U6 rates estimated by the graph for 2010 appears to be about 17-18%, which is closer but still not the numbers presented in the graphic. More to the point, if the Great Depression unemployment rate used by the graph is the estimated U3 rate (which seems likely), then comparing the U3 to the U6 is disingenuous.
One potentially biased source from EconomicPopulist.org cites the following:
Based on that research, [N. Andrews] was able to generate a mathematical formula to calculate U3 and U6 unemployment for the entire period since 1900. He found that at the peak of the Great Depression, U3 was 25.2%. U6 was 37.6%.
An interview of Robert Johnson conducted by Morningstar.com provides similar figures:
There was some academic work, where people have looked back and said, well if you constructed U6 the same way that it's constructed today, you'd be at something like 37%-38% unemployment rates on the U6 basis during the Great Depression. So, we are nowhere near that. Right now the number is about 16.6%.
Where is the graph getting the 20%+ statistics for modern era Unemployment? Well, a Forbes.com article stated it thusly:
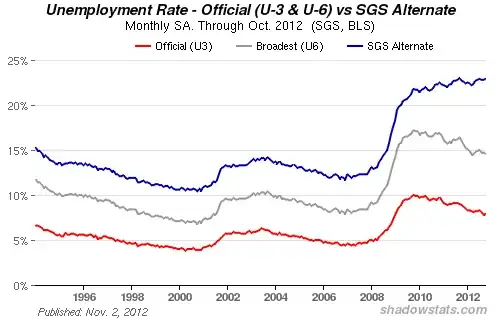
The U6 unemployment rate counts only 2.5 million of those 8.2 million who have given up hope and dropped out during the Obama years. The ShadowStats website, which counts the long term discouraged workers the government doesn’t count, reports the total rate for the unemployed and underemployed (part time for economic reasons) as 22.8%.
Basically, where the current 23% (which is actually 22.8% rounded up) comes from is the author of the site (John Williams) doing his own math and adding more long-term unemployed to the U6 rate, and here is the graph that the graphic refers to (SGS = Shadow Government Statistics, the website):
The other column in your graph, specifically referring to the Employment and Unemployment in the 1930's paper by Robert A. Margo from 1993, is taken from the third page of the PDF document.
However, what the graphic fails to mention is that Robert A. Margo actually delineates two different measures of Unemployment in the 1930's during the Great Depression. One by Darby and one by Lebergott (I've denoted the ones used in the graph):
Year  Lebergott  Darby
1929    3.2      3.2
1930    8.7      8.7
1931    15.9   **15.3**
1932    23.6   **22.9**
1933    24.9   **20.6**
1934    21.7   **16.0**
1935    20.1     14.2
1936    16.9     9.9
1937    14.3     9.1
1938    19.0     12.5
1939    17.2     11.3
1940    14.6     9.5
The difference between the two sets, as Robert A. Margo puts it:
The difference between Lebergott's and Darby's series
reflects the treatment of persons with so-called "work relief" jobs. For
Lebergott, persons on work relief are unemployed, while Darby counts them as
employed.
"Work Relief" in this context were the government-funded jobs programs for public works.
The problem with using Darby's numbers, as Robert A. Margo outlines, is this:
In counting persons on work relief as unemployed, Lebergott (1964) was effectively following census practice in 1940... Consistency with the search approach to unemployment would, at the very least, require that such persons be separated out from the unemployed who were actively searching for work, which Darby fails to do. I am grateful to Stanley Lebergott for these points.
Lebergott's numbers are calculated the same way that the BLS calculated U3 numbers in the 1940's. Darby's numbers come from counting everybody building roads as "Employed", which is why the numbers differ drastically in an era where great public work projects was the target of significant government spending.
So, to sum up:
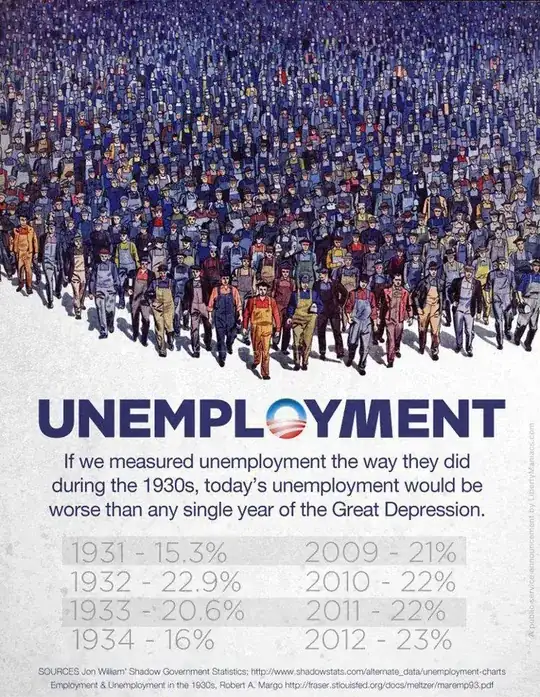
The graphic presented in the question is comparing what is essentially John Williams' (U6 + "Other Factors") Unemployment rate to Darby's Unemployment rate, which is significantly less than the U3 Rate for the same era. The creator of the graphic is cherry-picking the highest numbers they could find for 2008-2012, and the lowest numbers (lower than what the BLS would calculate) they could find for the Great depression.
Ultimately, NO - the two cannot be compared. They are not only calculated in a wildly different fashion, but there's a significant amount of dishonesty by omitting Robert A. Margo's preference for Lebergott's numbers over Darby's because Lebergott's were calculated using practically the same method that the BLS uses.
As far as I am able to tell, unemployment rates in the Great Depression peaked at double the highest rate from 2008-2012 when you compare the same measurements.