3

I have an Intel 760P NVME drive hooked up to a Supermicro X11SRM-F with a Xeon W-2155 and 64GB of ddr4-2400 RAM. The specs for this drive claim 205K-265K IOPS (whatever 8GB span means) with about 3G/s random-read and 1.3G/s random write.

I've tried using this drive under an LVM layer, as well as a bare partition and just can't get anywhere near the advertised performance out of it.

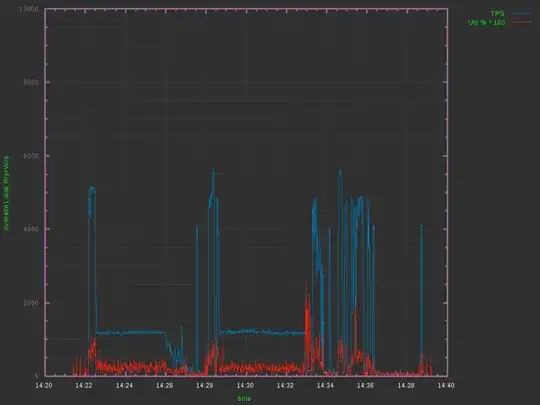
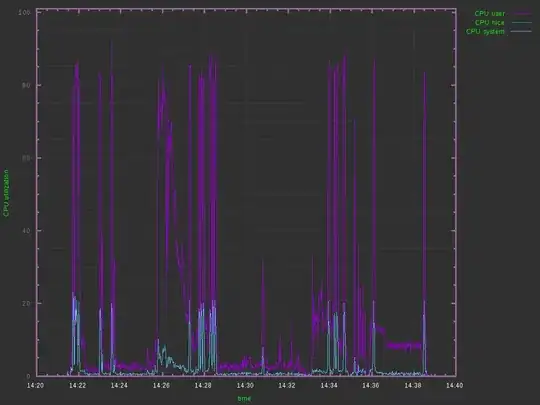
Running a typical process on the drive yields (via iostat) about 75MB/s write, with about 5K TPS (IOPS). iostat also shows disk utilization around 20% (graphs attached below) so it seems something is still bottlenecking somewhere. A regular Intel SSD over a SATA cable will outperform the drive at this point. Any ideas what to look at?

enter image description here enter image description here enter image description here

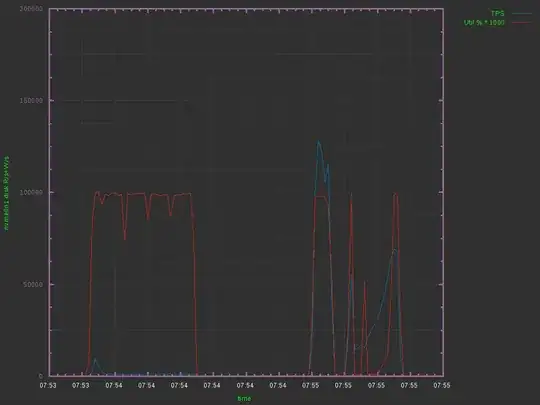
UPDATE: As mentioned by @John Mahowald - Seems to be application (Ruby) bottleneck!? graphs below from this fio command script (had to bump-up the graph scaling.. ~700MB/s writes and well over 50K TPS:

# full write pass
fio --name=writefile --size=10G --filesize=80G \
--filename=disk_test.bin --bs=1M --nrfiles=1 \
--direct=1 --sync=0 --randrepeat=0 --rw=write --refill_buffers --end_fsync=1 \
--iodepth=200 --ioengine=libaio

# rand read
fio --time_based --name=benchmark --size=80G --runtime=30 \
--filename=disk_test.bin --ioengine=libaio --randrepeat=0 \
--iodepth=128 --direct=1 --invalidate=1 --verify=0 --verify_fatal=0 \
--numjobs=4 --rw=randread --blocksize=4k --group_reporting

# rand write
fio --time_based --name=benchmark --size=80G --runtime=30 \
--filename=disk_test.bin --ioengine=libaio --randrepeat=0 \
--iodepth=128 --direct=1 --invalidate=1 --verify=0 --verify_fatal=0 \
--numjobs=4 --rw=randwrite --blocksize=4k --group_reporting
TPS/Utilization Write load

Server Fault
  • 3,714
  • 12
  • 54
  • 89
  • What application are you using to generate storage load? Likely your actual apps cannot generate nearly that many IOPS. Try a storage load tester like fio. – John Mahowald Oct 02 '18 at 21:38
  • Wow thanks. Added graphs of `fio` run. Script is modified version of of some google SSD benchmark. https://wiki.mikejung.biz/Benchmarking – Server Fault Oct 03 '18 at 13:08

1 Answers1

2

The much higher IOPS with fio versus the original benchmark suggest there is a limiting factor somewhere other than the storage system.

For capacity planning, estimate what storage performance you actually need. Take your TPS numbers from real load and guess what the IOPS needs will be.

200k IOPS is still far more than most single applications will ever request. (Which is a nice problem to have.) It is non-trivial to push 100k IOPS, even for synthetic load generators designed to exercise storage. That tends to require multiple parallel processes, tuning queue depths, and perhaps asynchronous I/O.

John Mahowald
  • 32,050
  • 2
  • 19
  • 34
  • The first graph shows CPU utilization approaching 90%. Perhaps peaking higher than that. The application generating that CPU load is a Jenkins process running Ruby application tests. I'm wondering if the total test stack is pushing the CPU load high enough that it's creating iowait? I could go back through the `iostat` data and find out what it was. Just not sure where to look first. – Server Fault Oct 08 '18 at 14:02
  • CPU utilization by itself will not tell the whole story. Try tracing some processes and see where exactly they spend their time. On Linux, start with `perf top` – John Mahowald Oct 09 '18 at 22:38