I have a problem on one webserver (IIS6) where aspnet_wp is using 100% cpu. There are several websites on this server. But how do I tell what website is causing the problem? The sites are in the 2.0 framework, and the server is running in IIS5 isolation mode.
Asked
Active
Viewed 476 times
3 Answers
7
For IIS6: At a command line, run cscript c:\windows\system32\iisapp.vbs. It will dump PIDs for each app pool, so you can track which one is pegged.
W3WP.exe PID: 12216   AppPoolId: A
W3WP.exe PID: 1632   AppPoolId: B
W3WP.exe PID: 8892   AppPoolId: C
For IIS7: appcmd apppool /?
spoulson
- 2,183
- 5
- 22
- 30
-
+1 is there a similar command for IIS7? – Nov 13 '09 at 18:44
-
Added IIS7 details for ya – spoulson Nov 13 '09 at 19:03
-
Thanks, but the server is in IIS5 isolation mode, so there are no app pools. – Nov 13 '09 at 23:13
-
1For IIS 7 use appcmd list wp. That will get live info on the active worker processes. – Scott Forsyth Nov 15 '09 at 03:51
1
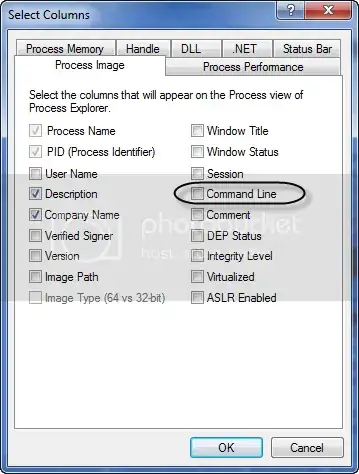
I've used SysInternals Process Explorer (now available from Microsoft's website) to view all processes running on the server. You can go into the options to view certain columns and turn on Command Line, this should show you the name of the application pool running the website.
We set up individual application pools for each site, that way if one crashes, it doesn't bring down all the sites. You could isolate each of your sites in their own apppools then use the tool to figure out exactly which one is causing the problem
Anthony Shaw
- 121
- 2
- 7
0
Since you're using IIS5 isolation mode, it's difficult to tell which site is using the CPU. You can't line it up with task manager.
iisstate and Debug Diag are 2 tools that may help you. If you can move out of IIS5 isolation mode you will get a new work process (w3wp.exe) per app pool, making it much easier to track it down. (and it's much easier again in IIS7)
Scott Forsyth
- 16,449
- 3
- 37
- 56