0

I'm struggling to figure out the correct settings for my Ubuntu server.

It has 16 CPUs and 48GB of Ram. However, it seems to be taking a while to respond to requests. Recently, I switched to PHP-FPM and Apache 2.4 mpm_worker.

My mpm_worker.conf file:

<IfModule mpm_worker_module>
    ServerLimit             250
    StartServers             10
    MinSpareThreads          75
    MaxSpareThreads         250 
    ThreadLimit              64
    ThreadsPerChild          32
    MaxClients             8000
    MaxRequestsPerChild   10000
</IfModule>

My /etc/php5/fpm/pool.d/www.conf settings:

pm = static
pm.max_children = 1200
pm.start_servers = 16
pm.min_spare_servers = 1
pm.max_spare_servers = 36
pm.max_requests = 800

What is the best way to go about figuring out the optimum values for the above settings and how do these two configuration files relate to one another? With Apache 2.4 and mod_php, you simply edit the mpm_prefork.conf file - However, with this setup, there are two separate configuration files that seem to have similar directive names.

A screenshot of top with the above settings: top

Other server details:

  • It is a cloud server with SSD for disk space.
  • There are multiple sites on the same server. However, the other hosts seem to be responding quickly.
  • It is a Digital Ocean droplet that uses KPM.
  • When I have 2,800 users on the site, requests can take up to 6 seconds. This is despite the fact that I am using Digital Ocean's load balancer to split requests between two servers (both of them are configured the same and both suffer from the same slowness).

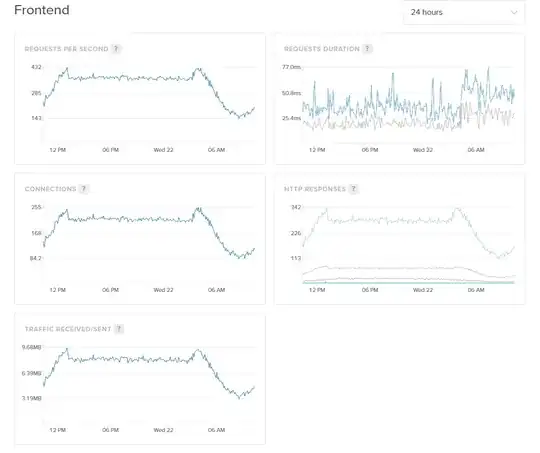
A screenshot of my load balancer stats, which shows that I can't seem to get above 430 requests per second:

load balancer

mybench.sh test results (dl speed exluded):

CPU model :  Intel(R) Xeon(R) CPU E5-2630L v2 @ 2.40GHz
Number of cores : 16
CPU frequency :  2399.998 MHz
Total amount of ram : 48303 MB
Total amount of swap : 1023 MB
System uptime :   6 days, 13:52,

I/O Tests...
IOPING Statistics:
10 requests completed in 9.0 s, 4.2 k iops, 16.3 MiB/s
min/avg/max/mdev = 139 us / 240 us / 447 us / 86 us
 I/O Read Speed by hdparm...
 Timing cached reads:   15068 MB in  2.00 seconds = 7541.02 MB/sec
 Timing buffered disk reads: 1096 MB in  3.00 seconds = 364.79 MB/sec
 I/O Read Speed, 100MB Testfile sequential read: 3400 MB/s
 I/O Read/Write + CPU, 'gzip -9' 100MB Testfile: 87.1795 MB/s
 I/O Write Speed 100MB 4KB Blocks:  324 MB/s
 I/O Write Speed 100MB 16KB Blocks  434 MB/s
 I/O Write Speed 100MB 64KB Blocks  404 MB/s
 I/O Write Speed 100MB 1MB Blocks  433 MB/s
Wayne
  • 73
  • 1
  • 11
  • Would you please provide informations about you disks/storage/array configuration and if you're running bare metal or virtual machine? If that, then which hypervisor? Could you help us understand "how slow" php-fpm responds? – Marco Mar 22 '17 at 10:08
  • I appended some details to the original question. It is hosted on a Digital Ocean droplet. Digital Ocean uses KPM and SSD. The PHP-FPM requests can take up to 6 seconds when there are around 2,800 users on the site. This is despite of the fact that I am using Digital Ocean's load balance to split requests between two servers (which are configured the same and have the same specs). Both servers show similar top results and both servers respond with a similar slowness. – Wayne Mar 22 '17 at 10:22
  • Judging from my load balancer stats, it seems that around 440 requests per second is my limit at the moment, which shouldn't be the case. – Wayne Mar 22 '17 at 10:23
  • http://i.imgur.com/yBfaARo.png – Wayne Mar 22 '17 at 10:25
  • http://mlnz.org/mybench.sh assumes you have ioping and hdparm. Open the script and comment out dlspeed tests. Check that right folders/partitions are referenced, or change em. Paste results. Confirm that your partitions are mounted noatime, I know that if not performance will be worse in high load envs cause to every disk read corresponds a disk write. Try to execute the script when your server is not in high load. – Marco Mar 22 '17 at 10:30
  • @Marco The server is at its lowest at the moment. Ran the test and added the results to the end of the original question. – Wayne Mar 22 '17 at 11:10
  • IO performance are as expected, the issue is not there. – Marco Mar 22 '17 at 11:14
  • For some strange reason, the other VirtualHost sites on the box all respond pretty quickly. It is the site that is receiving the most traffic that is slow. Surely they should all be relatively slow? – Wayne Mar 22 '17 at 11:19
  • BTW, monitor your server with iotop when you experience slowness and confirm it's not tapped. I would install sar and schedule it to be ran every 5 minutes and I'd take a look to a one dai report. Especially CPU usage and IOwait %. Come back to us with the results when you're done. – Marco Mar 22 '17 at 11:20
  • I'm not sure if this is a fix or not - but I got rid of calls to a subdomain that I created via an .htaccess file and the site seems to be responding much more quickly. I used a .htaccess file to create a img.mysite.com subdomain. This might explain why the other sites on the same server were responding just fine? – Wayne Mar 22 '17 at 15:04
  • Without sar output we can only guess. We won't know if it was hanging due to application or system. – Marco Mar 22 '17 at 15:10

0 Answers0