0

I am looking for a way to view CPU usage for multiple VMs on the same graph in Azure (new portal)?

So far I was only able to produce a graph showing metrics for 1 VM. I would like to achieve this for multiple VMs. Any help is greatly appreciated.

Update

What I'm trying to recreate is the below:

enter image description here

Regards,J

joebegborg07
  • 869
  • 5
  • 16
  • 24
  • Define Azure. Application Insights? – TomTom Dec 20 '16 at 10:47
  • @TomTom Insights is not enabled so to answer your question, no not specifically though application insights. I need to view CPU metrics for multiple front end vms for the past 4 months. Is this achievable through Azure? – joebegborg07 Dec 20 '16 at 10:53
  • No. Generally: Yes, but you ahve to actually make the work BEFORE you need the data. Nothing that I Know of keeps 4 months stats "just in case" in azure. With application insights you could do it, but you would not magically get past data. – TomTom Dec 20 '16 at 10:57
  • @TomTom I've updated my description with what I'm trying to replicate. – joebegborg07 Dec 20 '16 at 11:24
  • Are they all part of the same cloud service? or are you using V2? – CtrlDot Dec 20 '16 at 23:53
  • @CtrlDot They are 4 individual Classic VMs under the same subscription and resource group – joebegborg07 Dec 21 '16 at 08:59

1 Answers1

1

You could use Azure OMS to achieve your scenario.

With near real-time performance data collection, you can collect and visualize any performance counter in OMS. Simply entering the query Type:Perf will return thousands of metric graphs based on the number of counters and servers in your OMS environment. With on-demand metric aggregation, you can look at the overall metrics in your environment at a high level, and deep dive into more granular data as you need to.

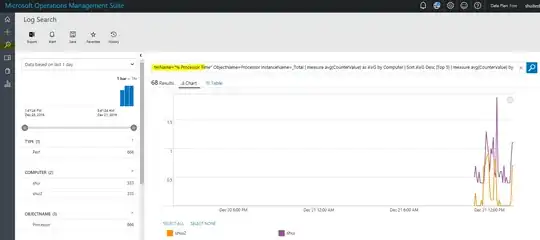
You could perform the hourly average of CPU usage across all your computer as follows:

Type:Perf CounterName="% Processor Time" ObjectName=Processor InstanceName=_Total Computer IN {Type:Perf CounterName="% Processor Time" ObjectName=Processor InstanceName=_Total | measure avg(CounterValue) as AVG by Computer | Sort AVG Desc |Top 5} | measure avg(CounterValue) by Computer Interval 5MINUTES

enter image description here

Please refer to the steps below.

1.Create Log Analytics resource in your resource group.

2.Connect your VMs to this workspace. enter image description here 3. Get metrics in OMS Portal.

More information about OMS please refer to this article

Shui shengbao
  • 3,583
  • 1
  • 11
  • 20
  • I find a good article about your scenario, https://blogs.technet.microsoft.com/msoms/2016/02/26/on-demand-metric-aggregation-and-visualization-in-oms/ – Shui shengbao Dec 21 '16 at 05:53
  • thanks for the info. I will be experimenting with OMS in the near future as it seems to be a good product. My next hurdle is to export azure metrics. Any experience with exporting results ? – joebegborg07 Dec 21 '16 at 09:28
  • Yes, you could. On my screenshot, you could see "Export" button, it is a .csv file. – Shui shengbao Dec 21 '16 at 09:47
  • thanks for the reply. Is this not achievable with the standard Azure metrics feature ? – joebegborg07 Dec 21 '16 at 10:09
  • Yes. For now, Azure does not support multiple VMs on the same graph with the standard Azure metrics feature. – Shui shengbao Dec 21 '16 at 10:12
  • Classic VMs support connect to OMs if they are in the same region. – Shui shengbao Dec 21 '16 at 10:24
  • Thanks for your help. Already marked your answer as helpful, however I did not use it in the end (even though I will be testing OMS in the near future). I used metrics for Cloud Services (Since VMs were classic VMs); and even there metrics were unavailable for a specific timeframe during which then resources were definitely operational. Thanks again for your input – joebegborg07 Dec 22 '16 at 09:14
  • Let us [continue this discussion in chat](http://chat.stackexchange.com/rooms/50517/discussion-between-walter-msft-and-joebegborg07). – Shui shengbao Dec 22 '16 at 09:36