I have a running Tomcat v9 instance in a Docker container on an AWS EC2 host.
It works perfectly, most of the time, and will once in a while deliver resources very slowly.
What exactly is served slowly and what is "slow"?
I'm talking about both plain static files outside any WAR but also -- and more annoyingly, servlet responses.
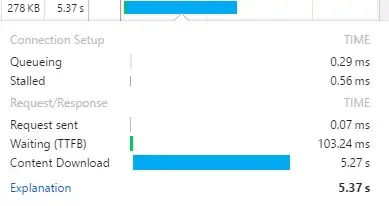
I witness some 300 to 400KB resources served in 5 to 12s, where they usually (95%+ of the time) arrive in ~300ms.
Here's an example of what Chrome's Network tab tells me about these dreaful resource transfers:
I have no idea what causes this. I have read many threads and tried many configurations but still can't understand what is going on.
From within my VPC
As @Tim suggested, I tried putting the client inside my AWS VPC to rule out network latency and bandwidth as the cause of the issue.
In this setup, I get answers "much slower", with a minimum Content Download time of ~600ms where it could sometimes be only 200ms in the "outside world".
I still notice the slow peaks that are an issue to me, but instead of going for tens of times the minimum, "normal" download duration, it goes up only to about 2.5s at most.
Response size | 319 KB ------------------------------ Waiting (TTFB) | 99.00 ms Content Download | 2.81 s
The "waiting" time is the same, as expected since it represents the time spent by my servlet to treat the request before starting to respond.
My environment(s)
I have replicated that phenomenon with the following environment configurations:
On AWS linux AMI t2.medium
- Tomcat v9 WITHOUT Docker
- Tomcat v9 w/ Docker
- Tomcat v8.5 w/ Docker
- Tomcat v8.0 w/ Docker
Tomcat v9 w/ Docker on:
- AWS linux AMI
t2.micro - AWS linux AMI
t2.medium - AWS linux AMI
m4.xlarge
On AWS linux AMI t2.medium via ECS
- Tomcat v9 w/ Docker
At least half of these tests are probably stupid, but well... better too much information than too little.
What I think I can rule out after these is:
- my instance is too small (fails with
m4.xlarge) - Tomcat's newer versions somehow handle things differently
- Docker container's overhead messing things up
My Tomcat configuration
Alright, it must come from there, right? So, here it is:
<?xml version="1.0" encoding="UTF-8"?>
<Server port="8005" shutdown="SHUTDOWN">
<Listener className="org.apache.catalina.startup.VersionLoggerListener" />
<Listener className="org.apache.catalina.core.JreMemoryLeakPreventionListener" />
<Listener className="org.apache.catalina.mbeans.GlobalResourcesLifecycleListener" />
<Listener className="org.apache.catalina.core.ThreadLocalLeakPreventionListener" />
<Service name="Catalina">
<Connector port="8009" protocol="AJP/1.3" redirectPort="8443" maxThreads="1500" />
<Connector port="8080" protocol="HTTP/1.1" connectionTimeout="20000" redirectPort="443" maxThreads="1500" />
<Connector port="8443" protocol="org.apache.coyote.http11.Http11Nio2Protocol" sslImplementationName="org.apache.tomcat.util.net.jsse.JSSEImplementation" maxThreads="1500" SSLEnabled="true"
scheme="https" secure="true" keystoreFile="/root/ssl/XXXXXXXX.jks" keystorePass="XXXXXXXX" clientAuth="false" sslProtocol="TLS" compression="on" compressionMinSize="1024"
compressableMimeType="application/json" />
<Engine name="Catalina" defaultHost="localhost">
<Realm className="org.apache.catalina.realm.LockOutRealm">
<Realm />
</Realm>
<Host name="localhost" appBase="webapps" unpackWARs="true" autoDeploy="true">
<Valve className="org.apache.catalina.valves.AccessLogValve" directory="logs" prefix="localhost_access_log." suffix=".txt" pattern="%h %l %u %t "%r" %s %b" />
</Host>
</Engine>
</Service>
</Server>
The <Realm /> bit is of course to be replaced by an actual JDBC Realm configuration. Just pointing that out; it's not the issue anyways :).
As you can see, I have tried increasing the maxThreads attribute in all my connectors, as featured in that answer. No changes.
More information
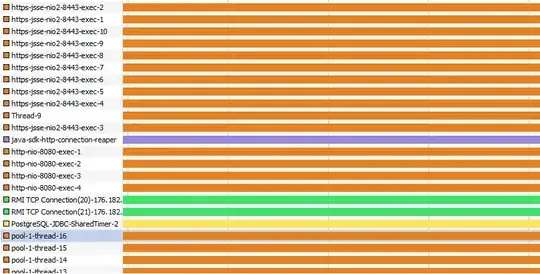
I have a JMX thingy showing me what's going on on my JVM exactly, I use VisualVM to visualise it all but, as you can probably guess by how I talk about it, I have close to no idea what I'm looking at.
My https-jsse-nio2-8443-exec-X threads, which are the only ones that seem to be doing something when a request hit the server, are just indifferent to "slow" or "normal" requests. But then again, maybe I just don't see it.
Maybe YOU would see it though :), so here's a screenshot of VisualVM during a slow request:
It's just "parked" (orange color) and sometimes goes "running" (green), but just momentarily and it doesn't match "slow" requests or anything. Maybe there's actually nothing to see here.
I can provide you with thread dumps and everything you need!
My actual question
What can I change to have a consistent and reasonable transfer rate?


