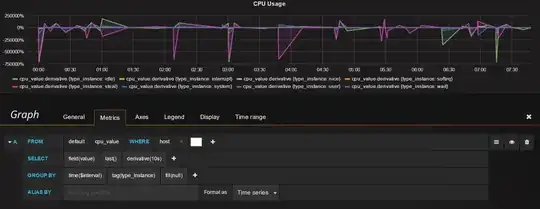
I am trying to plot CPU usage in Grafana. Collectd gives metric to InfluxDB and I get metric from Influxdb into Grafana. I have tried taking derivative of last value but CPU is in negative. I want it to be in percentage.
Asked
Active
Viewed 7,665 times
1 Answers
2
This is behaving as expected. Derivative will give you the change, not absolute value. So negative means your CPU usage went down. The idle, system, user stats are already in percent on unix, so you can display them directly, without usage of derivative.
If you want to display the average of the last x seconds, to smooth your graph out, use transform -> summarize, and chose avg as method of summarization.
mzhaase
- 3,798
- 2
- 20
- 32
