1

The CPU usage on my Windows Server spikes up to 100% every 22 minutes.

How do I know? I have set up a "Data Collector Set" in perfmon, ran it for several hours on my server and then viewed the log file. I can see that the CPU usage jumps to 100% every 22 minutes.

How do I tell which process uses it?

PS. Perfmon can measure CPU usage for "all processes", but only for the processes that are already running when the logging is started...

So. Any ideas (except for sitting and staring at Task Manager for 22 minutes :)
serge
  • 123
  • 1
  • 8
  • So you don't think it's a currently running process, you think it's a process that's being spawned some time after you start your data collection? – joeqwerty Mar 15 '16 at 20:25
  • If you know it's every 22 minutes, why don't you simply check you task manager at time X, where X is now + 22 - minutes past last occurrence? – Daniel Mar 16 '16 at 05:02
  • @Daniel I did check the task manager and the obvious places. – serge Mar 16 '16 at 06:22
  • @joeqwerty it's a web server with many ASP.NET apps tha basically runs a dozen w3wp.exe processes that are being recycled all the time (restarted with new PIDs). So yes, it probably is not a running process, a spawned one. Also there are things like "software protection service" that are spawned by windows... and a dozen other options. – serge Mar 16 '16 at 06:25

1 Answers1

1

A bit unconventional perhaps, but this is one solution.

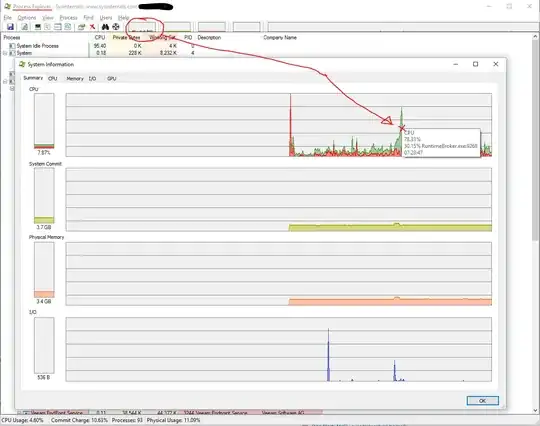
Download procexp.exe from Sysinternals and run it.

Click on one of the graphs in the top area.

Let the graph run for 10 minutes or so. It updates every second. If you widen the graph window, you'll be able to track a bigger time delta.

When you see a spike, use your mouse cursor to hover over the graph and see the responsible processes.

Process Explorer Graphs

Daniel
  • 6,940
  • 6
  • 33
  • 64