We are using Orca for performance monitoring on a number of solaris servers. We've got plots for hourly, daily, weekly, monthly, quarterly and yearly.
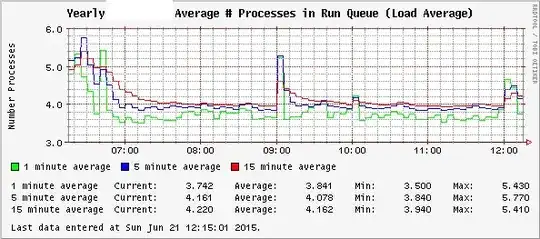
However, the yearly plot is displaying hour times on the x-axis, which is clearly incorrect.
Is there a way to fix this?
Sample yearly graph: