I've just set up cacti to monitor CPU and memory usage on a server that I think needs to be upgraded, but to be able to make my case for funding I need hard facts.
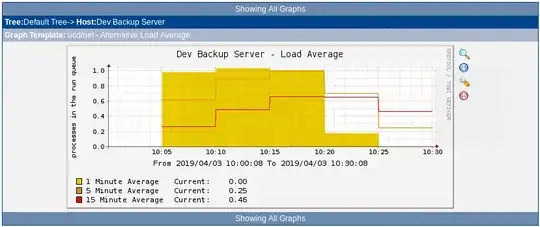
I figured getting Cacti to monitor the Memory usage and Load Average would do the trick, but the graph being generated seems to bear no correlation to reality.
According to top my load average right now is hovering at around 5, but cacti is graphing it at 0.1!
How can I get cacti to monitor the real load averages on the server? The server to be monitored is running RHEL5 and using net-SNMP as the SNMP deamon.
Thanks,
Bart.


