With Cacti you are not limited only to SNMP queries.
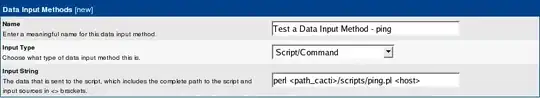
You can choose to run any script of your own as a Data Input Method. It could be Perl, PHP, Python, Bash or whatever. Just choose the Script/Command input type :
Your script has to output at least one value. This value will be attached to an output field within Cacti and used later to create the final graph.
If you only need one output field, just print the value as it is (eg 12) without anything else (eg ms, %) :
#!/bin/sh
ping -c1 host | grep rtt | cut -d"=" -f2 | cut -d"/" -f2
In case you have to retrieve multiple values, the output format has to be :
field1:value1 field2:value2 field3:value3
Then each field will be attached to an ouput field.
#!/bin/sh
result=$(ping -c1 host | grep rtt | cut -d"=" -f2)
min=$(echo $result | cut -d"/" -f1)
avg=$(echo $result | cut -d"/" -f2)
max=$(echo $result | cut -d"/" -f3)
echo "min:$min avg:$avg max:$max"
You can find further explanation and examples here :