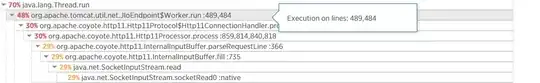
org.apache.tomcat.util.net.JIoEndpoint takes more memory as per new relic Thread profiler. The memory utilization never reduced even in idle time. It seems there is a memory leak in this class. Could you please help me to debug little more?
org.apache.tomcat.util.net.JIoEndpoint takes more memory as per new relic Thread profiler. The memory utilization never reduced even in idle time. It seems there is a memory leak in this class. Could you please help me to debug little more?