0

I want to improve my zabbix graphs,

Something like desribed in this netflix article (about sps)

http://techblog.netflix.com/2015/02/sps-pulse-of-netflix-streaming.html

enter image description here

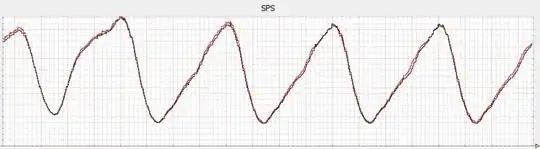
Show current data under the data of previous period.

It mean draw current day data over prev day data.

Is it possible?

If its impossible in zabbix, what I could use for that?

Korjavin Ivan
  • 2,250
  • 2
  • 26
  • 41

1 Answers1

0

It's possible. You have to create new calculated item, where do you use some function (avg) with optional parameter time_shift (e.g 1 day). And then you will need to create graph with original item and calculated (time shifted) item.

Disadvantage is that you store the same data twice.

Examples: return the average value for last minute

avg(60)

will return the average value for a minute one day ago (timeshifted value)

avg(60,86400)

Doc is your friend: https://www.zabbix.com/documentation/2.4/manual/appendix/triggers/functions

Jan Garaj
  • 879
  • 1
  • 7
  • 15
  • Sorry, but its something different. It will be one value which is average for that day. Its not a shift, its a period for apply avg – Korjavin Ivan Feb 12 '15 at 14:10