I have read through Is a 'high' IO rate healthy?, and was at ease when I read someone say that even 50,000 / hr wasn't an issue.... or not unhealthy, to answer their question; so I increased the IO threshold to 20,000. Unfortunately, my IO warning messages have been giving me IO Rates of like 15,000+ blocks/sec. as you can see from the image below.
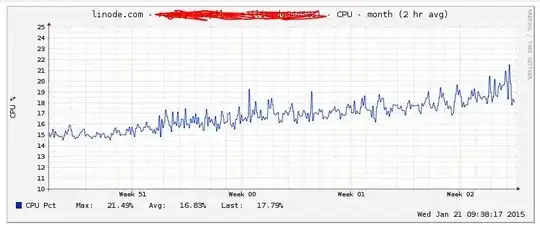
Although when I compared the OPs graphs with mine, there was a BIG difference. I have no single, offending spike like the OP of that question has, I have several spikes so close to each other than it appears .... well, like this
CPU
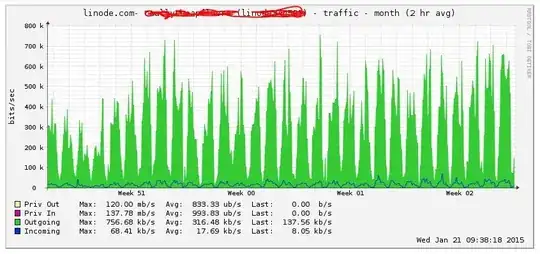
 Network
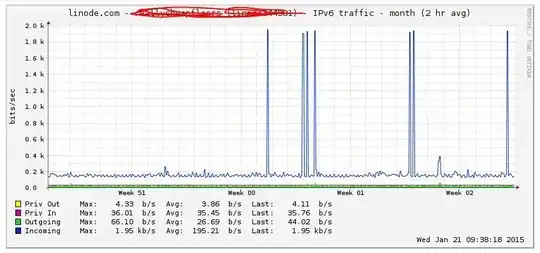
 Network IPv6
 Disk IO
I have performed the various functions to check what could be causing this.
[username@li123-456 ~]$ df -hP
Filesystem            Size  Used Avail Use% Mounted on
/dev/xvda              24G   13G   10G  55% /
tmpfs                 494M  116K  493M   1% /dev/shm
[username@li123-456 ~]$ free -m
             total       used       free     shared    buffers     cached
Mem:          1992       1822        170          0        240        518
-/+ buffers/cache:       1063        929
Swap:          511         94        417
[username@li123-456 ~]$ sudo iotop
Total DISK READ: 0.00 B/s | Total DISK WRITE: 0.00 B/s
  TID  PRIO  USER     DISK READ  DISK WRITE  SWAPIN     IO>    COMMAND
    1 be/4 root        0.00 B/s    0.00 B/s  0.00 %  0.00 % init
    2 be/4 root        0.00 B/s    0.00 B/s  0.00 %  0.00 % [kthreadd]
    3 be/4 root        0.00 B/s    0.00 B/s  0.00 %  0.00 % [ksoftirqd/0]
    5 be/0 root        0.00 B/s    0.00 B/s  0.00 %  0.00 % [kworker/0:0H]
    7 be/4 root        0.00 B/s    0.00 B/s  0.00 %  0.00 % [rcu_sched]
    8 be/4 root        0.00 B/s    0.00 B/s  0.00 %  0.00 % [rcu_bh]
    9 rt/4 root        0.00 B/s    0.00 B/s  0.00 %  0.00 % [migration/0]
   10 rt/4 root        0.00 B/s    0.00 B/s  0.00 %  0.00 % [migration/1]
   11 be/4 root        0.00 B/s    0.00 B/s  0.00 %  0.00 % [ksoftirqd/1]
   13 be/0 root        0.00 B/s    0.00 B/s  0.00 %  0.00 % [kworker/1:0H]
   14 rt/4 root        0.00 B/s    0.00 B/s  0.00 %  0.00 % [migration/2]
   15 be/4 root        0.00 B/s    0.00 B/s  0.00 %  0.00 % [ksoftirqd/2]
 2064 be/4 named       0.00 B/s    0.00 B/s  0.00 %  0.00 % named -u named
   17 be/0 root        0.00 B/s    0.00 B/s  0.00 %  0.00 % [kworker/2:0H]
   18 rt/4 root        0.00 B/s    0.00 B/s  0.00 %  0.00 % [migration/3]
   19 be/4 root        0.00 B/s    0.00 B/s  0.00 %  0.00 % [ksoftirqd/3]
 2068 be/4 named       0.00 B/s    0.00 B/s  0.00 %  0.00 % named -u named
   21 be/0 root        0.00 B/s    0.00 B/s  0.00 %  0.00 % [kworker/3:0H]
   22 rt/4 root        0.00 B/s    0.00 B/s  0.00 %  0.00 % [migration/4]
   23 be/4 root        0.00 B/s    0.00 B/s  0.00 %  0.00 % [ksoftirqd/4]
 2072 be/4 named       0.00 B/s    0.00 B/s  0.00 %  0.00 % named -u named
   25 be/0 root        0.00 B/s    0.00 B/s  0.00 %  0.00 % [kworker/4:0H]
   26 rt/4 root        0.00 B/s    0.00 B/s  0.00 %  0.00 % [migration/5]
   27 be/4 root        0.00 B/s    0.00 B/s  0.00 %  0.00 % [ksoftirqd/5]
   29 be/0 root        0.00 B/s    0.00 B/s  0.00 %  0.00 % [kworker/5:0H]
   30 rt/4 root        0.00 B/s    0.00 B/s  0.00 %  0.00 % [migration/6]
[username@li123-456 ~]$ sudo top
top - 09:43:29 up 153 days, 49 min,  1 user,  load average: 0.06, 0.20, 0.22
Tasks: 160 total,   1 running, 159 sleeping,   0 stopped,   0 zombie
Cpu(s):  1.2%us,  0.1%sy,  0.0%ni, 98.1%id,  0.6%wa,  0.0%hi,  0.0%si,  0.0%st
Mem:   1012108k total,   977296k used,    34812k free,    41592k buffers
Swap:   524284k total,    53540k used,   470744k free,   626556k cached

  PID USER      PR  NI  VIRT  RES  SHR S %CPU %MEM    TIME+  COMMAND
    1 root      20   0 19412  904  680 S  0.0  0.1   0:51.03 init
    2 root      20   0     0    0    0 S  0.0  0.0   0:02.96 kthreadd
    3 root      20   0     0    0    0 S  0.0  0.0   4:54.17 ksoftirqd/0
    5 root       0 -20     0    0    0 S  0.0  0.0   0:00.00 kworker/0:0H
    7 root      20   0     0    0    0 S  0.0  0.0  25:13.84 rcu_sched
    8 root      20   0     0    0    0 S  0.0  0.0   0:00.00 rcu_bh
    9 root      RT   0     0    0    0 S  0.0  0.0   0:02.68 migration/0
   10 root      RT   0     0    0    0 S  0.0  0.0   0:08.90 migration/1
   11 root      20   0     0    0    0 S  0.0  0.0   0:33.80 ksoftirqd/1
   13 root       0 -20     0    0    0 S  0.0  0.0   0:00.00 kworker/1:0H
   14 root      RT   0     0    0    0 S  0.0  0.0   0:03.37 migration/2
   15 root      20   0     0    0    0 S  0.0  0.0   0:18.35 ksoftirqd/2
   17 root       0 -20     0    0    0 S  0.0  0.0   0:00.00 kworker/2:0H
   18 root      RT   0     0    0    0 S  0.0  0.0   0:04.00 migration/3
   19 root      20   0     0    0    0 S  0.0  0.0   0:13.21 ksoftirqd/3
   21 root       0 -20     0    0    0 S  0.0  0.0   0:00.00 kworker/3:0H
   22 root      RT   0     0    0    0 S  0.0  0.0   0:04.43 migration/4
With all of those zeroes, I can't figure much out. I'm not using a lot of harddrive space, a little more than half, it doesn't look as if I'm swapping too much. Unfortunately, I'm not exactly an expert in this field so I can only provide the information that I have and ask for advice, help, guidance.
Updates
I checked both the access and error logs, it's been awhile since I checked them. There are a lot of PHP errors in there as well, but they are just notices (e.g. undefined variable), invalid index, file does not exist.)
I truncated both files and tailed them tail -f and began to wonder if the amount of images loaded each time would be the biggest culprit.