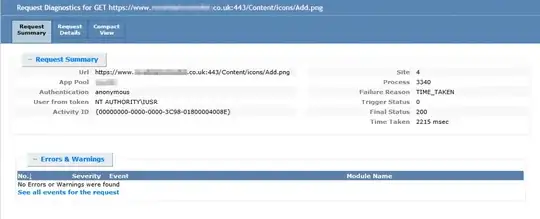
We're hosting an ASP.Net MVC web app on Windows Server 2012, which runs over HTTPS. Most of the time everything is nice and fast, but we've noticed that about 1 in 50 requests for static files (e.g. images, javascript) are taking a few seconds seconds to complete. Some dynamic pages are also taking a while to complete too, but sometimes this is expected (e.g. performing a complex database query) although not always.
We've set up Failed Request Tracing on the website in IIS 8, and have set up a rule to log anything that takes over 2 seconds. We're getting about one log file generated per minute, and there is no pattern that I can identify – it's not like it's always the same static file for example.
In the example below, the request for a 20kb PNG image took 2,215 msec to complete. My understanding is that this isn't dependent on the user's connection speed and that this is just the time that the server took to process the request (please correct me if I'm wrong).
What I don't understand is why the Performance View just shows 0ms for each item. Similarly in the Compact View all the times are exactly the same. This means that it's not possible to see which part of the request is slowing things down. My assumption would be that the sum of all the figures in the Performance View would add up to the Time taken figure. Is there a reason I'm missing for why this might not be the case?
Just in case it's relevant, this is an Amazon EC2 instance with the image files stored on an SSD backed EBS volume. The CPU load on the server is at a steady 10-20%.

