0

I am using PostgreSQL 9.3 server on my production server. Everything had been working fine for the past couple of months. But since the past week or so, PostgreSQL seems to have becomes very slow with increased CPU and Disk usage.

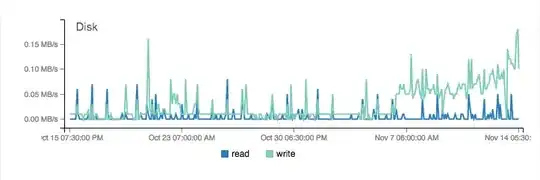
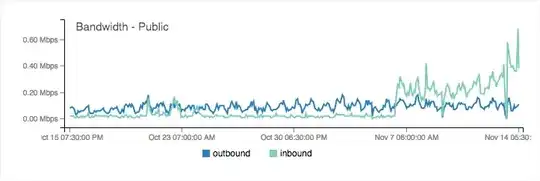
Here is the graph of CPU, Disk and Bandwidth usage over the past month

Monthly CPU Usage Monthly Disk Usage Monthly Bandwidth Usage

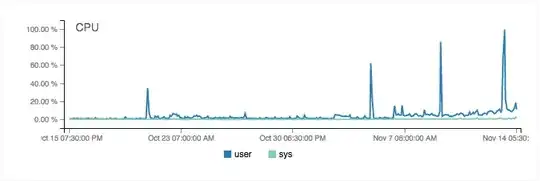
I'm using memcached to cache most of the queries. Web pages with few basic queries are faster while pages with complex queries take a lot of time. The server response time for such pages has increased from 0.2 seconds to 4 seconds (measured using Google PageSpeed Insights).

Following is my postgresql.conf tuned using PgTune.

default_statistics_target = 50
maintenance_work_mem = 60MB
constraint_exclusion = on
checkpoint_completion_target = 0.9
effective_cache_size = 704MB
work_mem = 6MB
wal_buffers = 8MB
checkpoint_segments = 16
shared_buffers = 240MB
max_connections = 80

Any ideas on what could have gone wrong? My website is a Django application hosted on DigitalOcean (1GB Ram, 30GB SSD Disk, Ubuntu 14.04 x64).

Yin Yang
  • 273
  • 3
  • 12

1 Answers1

0

Your network utilization increased at the same time, which indicates you are receiving more requests on this server, or more demanding ones with larger responses. If you haven't changed your configuration, this doesn't necessarily indicate something is wrong. You are probably just getting more traffic.

  • The traffic hasn't increased in the past couple 10 days. It's almost identical to 10 days before that. I'm getting an average of 1500 user per day for the past 20 days. This issue started just around 10 days ago. – Yin Yang Nov 17 '14 at 17:55
  • Is this a dedicated database server? If not, what other services are running on this server? – Walker Traylor Nov 17 '14 at 18:19
  • Yes, it is a dedicated database server. – Yin Yang Nov 17 '14 at 18:39
  • The chart shows that the inbound network bandwidth utilization quadrupled at the same time as the increased disk utilization. Why do you think that is? Are you absolutely sure you don't have increased number of queries or a change in query type? Do you have database query statistics of some sort running? – Walker Traylor Nov 17 '14 at 18:52
  • That's what has be baffled. The queries have been the same, no changes whatsoever. No, I do not have any database query statistics running. – Yin Yang Nov 17 '14 at 18:55
  • Are you firewalling everything other than database and management connections? Maybe this has nothing to do with the database. Perhaps you're getting hit with some sort of connection attempts on other ports that are being logged, which would explain the disk activity. – Walker Traylor Nov 19 '14 at 15:57