Over the past 10 days, I'm suddenly experiencing increased CPU usage on my website with CPU usage reaching 100% three times. During that time I'm unable to SSH to my website so I haven't been able to figure out what is actually using that much CPU but I have a feeling it's got to do something with Apache. My website is a Django application using Apache2, PostgreSQL and Memcached hosted on DigitalOcean(512MB Ram, 20GB SSD Disk, Ubuntu 14.04 x64).
Here is the output of top currently.
top - 16:15:31 up 19:12,  1 user,  load average: 0.01, 0.09, 0.46
Tasks:  78 total,   2 running,  76 sleeping,   0 stopped,   0 zombie
%Cpu(s):  9.5 us,  1.9 sy,  0.0 ni, 85.0 id,  3.3 wa,  0.3 hi,  0.0 si,  0.0 st
KiB Mem:    501868 total,   495576 used,     6292 free,    41836 buffers
KiB Swap:        0 total,        0 used,        0 free.   152976 cached Mem

  PID USER      PR  NI    VIRT    RES    SHR S %CPU %MEM     TIME+ COMMAND
15036 www-data  20   0  906084 156828   2448 S 19.3 31.2  12:08.08 apache2
    1 root      20   0   33472   1300      0 S  0.0  0.3   0:02.09 init
    2 root      20   0       0      0      0 S  0.0  0.0   0:00.02 kthreadd
    3 root      20   0       0      0      0 S  0.0  0.0   0:01.63 ksoftirqd/0
    5 root       0 -20       0      0      0 S  0.0  0.0   0:00.00 kworker/0:0H
    7 root      20   0       0      0      0 S  0.0  0.0   0:10.60 rcu_sched
    8 root      20   0       0      0      0 R  0.0  0.0   0:29.05 rcuos/0
    9 root      20   0       0      0      0 S  0.0  0.0   0:00.00 rcu_bh
   10 root      20   0       0      0      0 S  0.0  0.0   0:00.00 rcuob/0
   11 root      rt   0       0      0      0 S  0.0  0.0   0:00.00 migration/0
   12 root      rt   0       0      0      0 S  0.0  0.0   0:01.07 watchdog/0
   13 root       0 -20       0      0      0 S  0.0  0.0   0:00.00 khelper
   14 root      20   0       0      0      0 S  0.0  0.0   0:00.00 kdevtmpfs
   15 root       0 -20       0      0      0 S  0.0  0.0   0:00.00 netns
   16 root       0 -20       0      0      0 S  0.0  0.0   0:00.00 writeback
   17 root       0 -20       0      0      0 S  0.0  0.0   0:00.00 kintegrityd
   18 root       0 -20       0      0      0 S  0.0  0.0   0:00.00 bioset
   19 root       0 -20       0      0      0 S  0.0  0.0   0:00.00 kworker/u3:0
Here is the Apache conf file
<VirtualHost *:80>

    RewriteEngine On
    RewriteCond %{HTTP_HOST}  ^example.com [nocase]
    RewriteRule ^(.*)         http://www.example.com$1 [last,redirect=301]

    ServerName example.com
    ServerAlias www.example.com
    ServerAdmin admin@example.com

    WSGIDaemonProcess example python-path=/home/abc/example:/home/abc/example/env/lib/python2.7/site-packages
    WSGIProcessGroup example
    WSGIApplicationGroup %{GLOBAL}
    WSGIScriptAlias / /home/abc/example/wsgi.py

    DocumentRoot /home/abc/example

    <Directory />
        Require all granted
    </Directory>

    Alias /static/ /home/abc/example/static/

    <Directory /home/abc/example/static>
        Order deny,allow
        Allow from all
    </Directory>

    Alias /media/ /home/abc/example/media/

    <Directory /home/abc/example/media>
        Order deny,allow
        Allow from all
    </Directory>

    ErrorLog ${APACHE_LOG_DIR}/error.log
    CustomLog ${APACHE_LOG_DIR}/access.log combined

</VirtualHost>
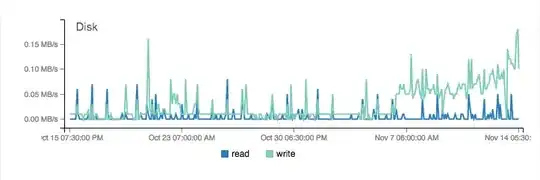
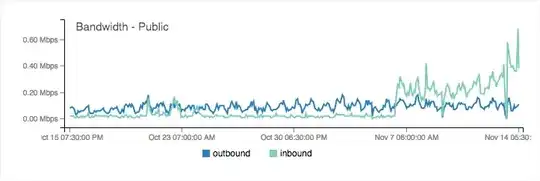
Here is the graph of CPU, Disk and Bandwidth usage over the past month
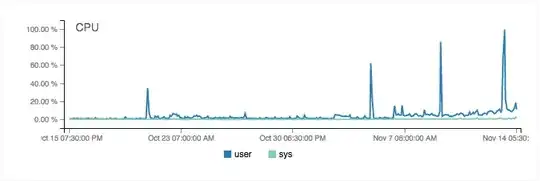
As you can see the CPU usage spiked 3 times over the past couple of days. I had to reboot my droplet to bring it down. The CPU usage generally used to vary between 0-5% up until a few days ago but has increased now.
The response time for the website has also increased to about 4 seconds. Everything seemed to be working fine up until around 10 days and I haven't made any changes to my configuration since then. There hasn't been an increase in the traffic with daily traffic being around 1500 visitors. How can I identify what's causing this issue? Any ideas?