5

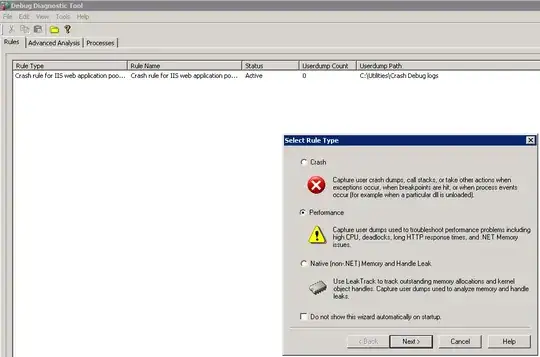
We have an application pool in IIS which a few applications belong to. According to Task Manager, this apppool is using over 4gb of memory, and I need to figure out which specific application is the cause of this.

Is there any way to get more information out?

3 Answers3

4

You can use Performance Monitor and Debug Diag to generate dumps on high memory use conditions, including IIS memory usage. Performance Monitor will let you track Asp.NET memory used (there are several counters there), and Debug Diag will let you capture user dumps based on performance counters.

debug diag screenshot

After Debug Diag processes a dump, it'll let you know which processes are using how much memory.

There's a longer article here. I hope that helps.

Katherine Villyard
  • 18,550
  • 4
  • 37
  • 59
1

I might take a simpler approach and just put each site into it's own app pool and see which one is growing out of control.

Dave Holland
  • 1,898
  • 1
  • 13
  • 18
0

Check whether the application is having more number of disk activity using process explorer tools. These tools will give you detail perspective of files and file handles information which are opened and used by the problematic process. It will let us know how many files handle and other handles (socket, thread, mutex handle, etc.) are used by the concern process during idle time.

BDRSuite
  • 400
  • 1
  • 9